Fig. 10.
Download original image
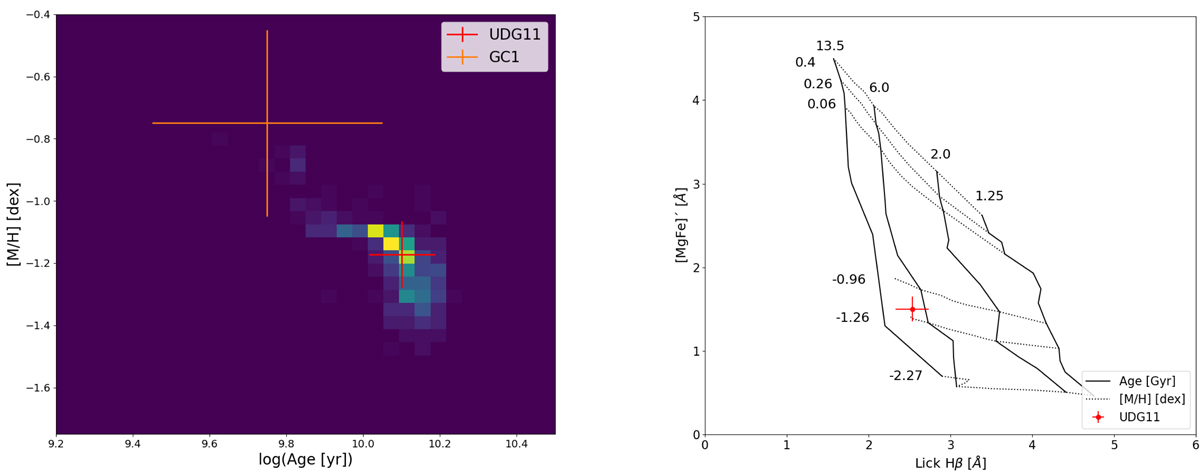
Mean age and metallicity for UDG11 derived from the stacked spectrum inside 1Re. Left panel: best fit derived using the pPXF code. The red cross corresponds to the values for age and metallicity (including errors) obtained by the best fit on the whole MUSE spectral range. The orange cross shows the average age and metallicity (including errors) for one of the confirmed GCs in UDG11 (see Sect. 5.5). Right panel: lick index measurements. Using the E-MILES BaSTI templates, we constructed the grid: vertical dashed lines denote models for the same age (left being the oldest), and horizontal dotted lines refer to model measurements for spectra with the same metallicity (with the most metal-poor ones located at the lower part).
Current usage metrics show cumulative count of Article Views (full-text article views including HTML views, PDF and ePub downloads, according to the available data) and Abstracts Views on Vision4Press platform.
Data correspond to usage on the plateform after 2015. The current usage metrics is available 48-96 hours after online publication and is updated daily on week days.
Initial download of the metrics may take a while.