Open Access
Fig. 4
Download original image
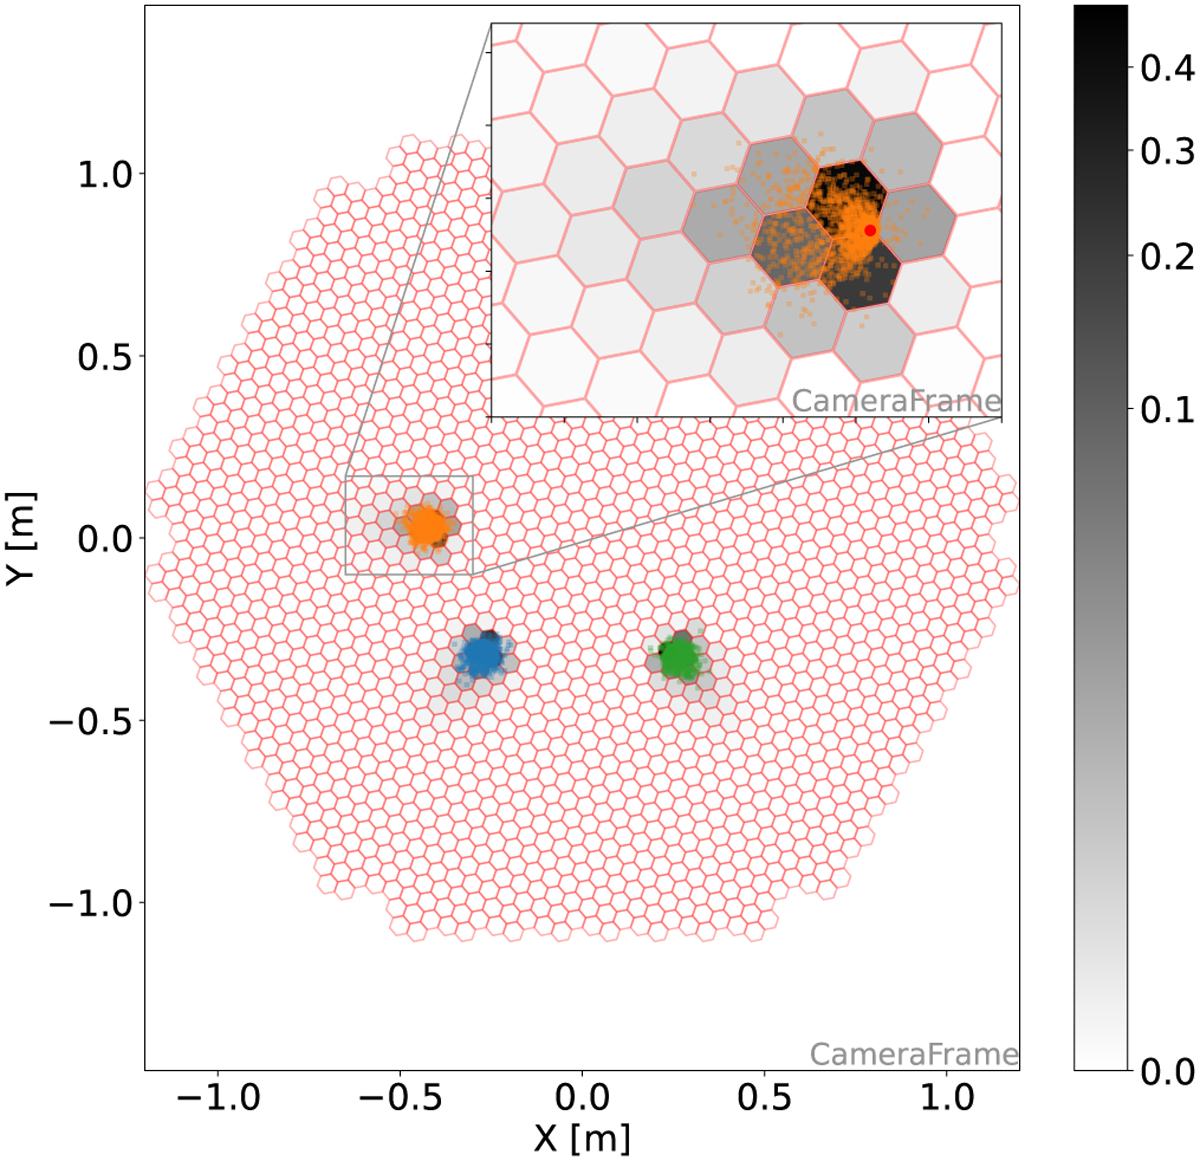
Distribution of star photons in the LST-1 photodetection plane. The different colors indicate different simulated stars, and the grayscale corresponds to the distribution of the star photon hit probability per each camera pixel. The red dot in the zoomed section indicates the true simulated star position.
Current usage metrics show cumulative count of Article Views (full-text article views including HTML views, PDF and ePub downloads, according to the available data) and Abstracts Views on Vision4Press platform.
Data correspond to usage on the plateform after 2015. The current usage metrics is available 48-96 hours after online publication and is updated daily on week days.
Initial download of the metrics may take a while.