Fig. 9
Download original image
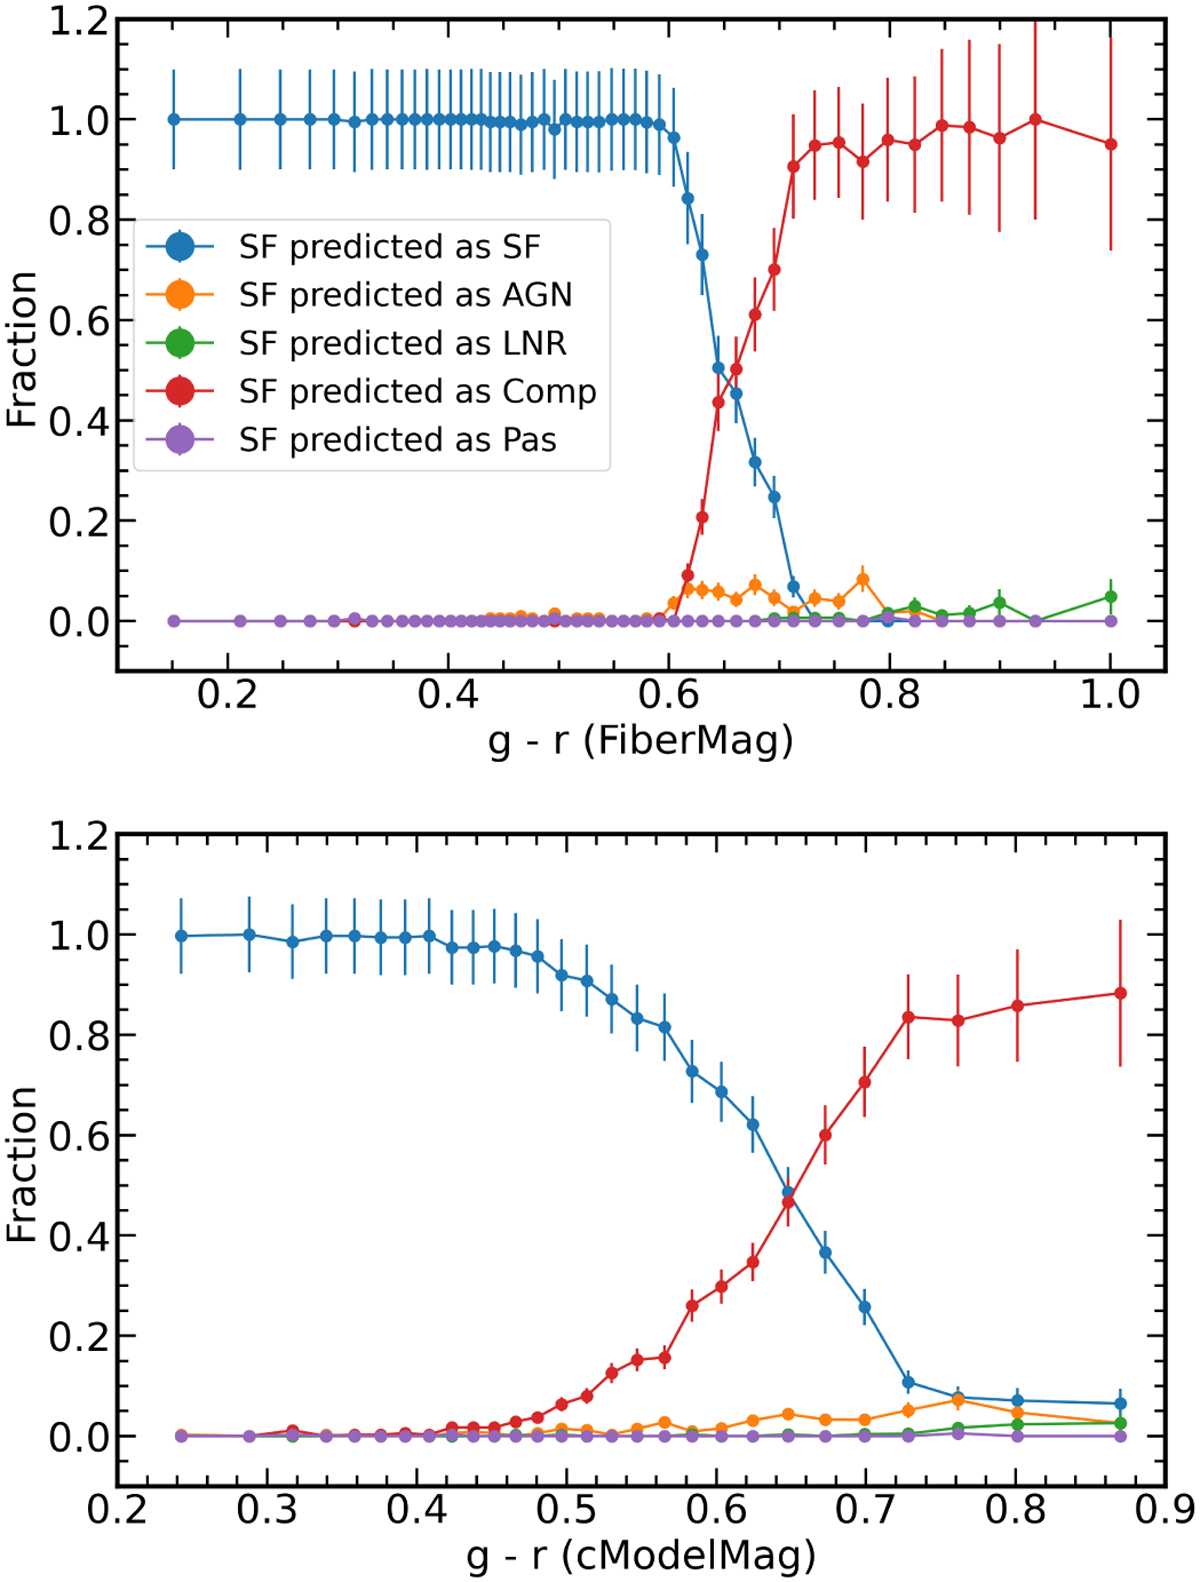
Two plots of the recall of SF galaxies as a function of the g–r (SDSS) color. The blue line shows the fraction of predicted SF galaxies to the total number of true SF galaxies per bin of increasing g–r color. The rest of the lines describe the fraction of SF galaxies that change classification (orange line, AGN; green line, LINER; red line, composite; purple, passive) to the total number of SF galaxies in a particular bin. On the top, we use the g–r color from fiberMag, while on the bottom plot we use the g–r color from the cModelMag photometry. Again, "Comp" stands for composite galaxies and "Pas" for passive galaxies.
Current usage metrics show cumulative count of Article Views (full-text article views including HTML views, PDF and ePub downloads, according to the available data) and Abstracts Views on Vision4Press platform.
Data correspond to usage on the plateform after 2015. The current usage metrics is available 48-96 hours after online publication and is updated daily on week days.
Initial download of the metrics may take a while.