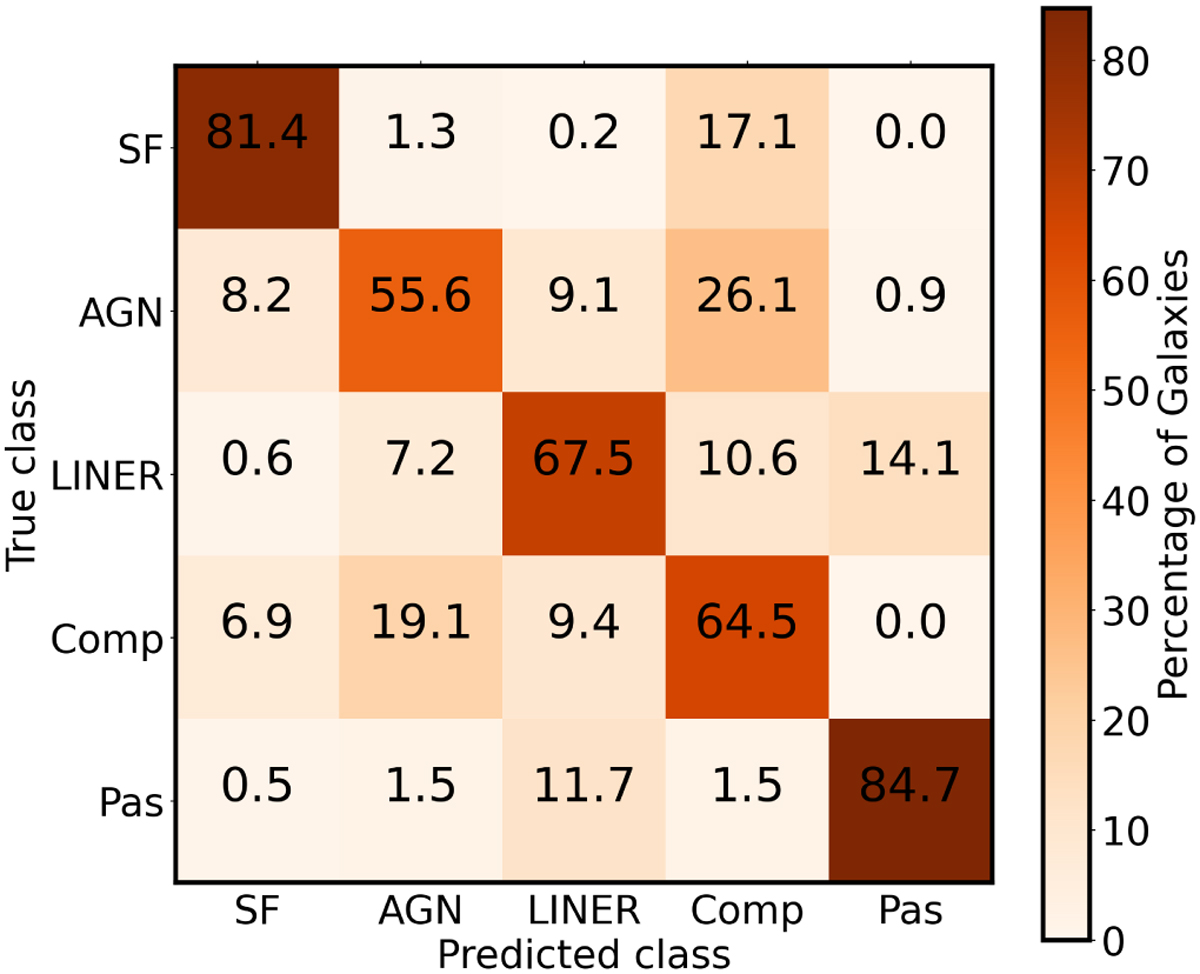
Fig. 5
Download original image
Confusion matrix for the test subset of galaxies. The numbers (and the color-code) in this plot represent the percentage of the classified objects in each class with respect to the total true population in each class. The labels on the x- and y-axis represent the predicted and the true class of a galaxy, respectively. Here "Comp" stands for composite galaxies and "Pas" for passive galaxies.
Current usage metrics show cumulative count of Article Views (full-text article views including HTML views, PDF and ePub downloads, according to the available data) and Abstracts Views on Vision4Press platform.
Data correspond to usage on the plateform after 2015. The current usage metrics is available 48-96 hours after online publication and is updated daily on week days.
Initial download of the metrics may take a while.