Fig. 3
Download original image
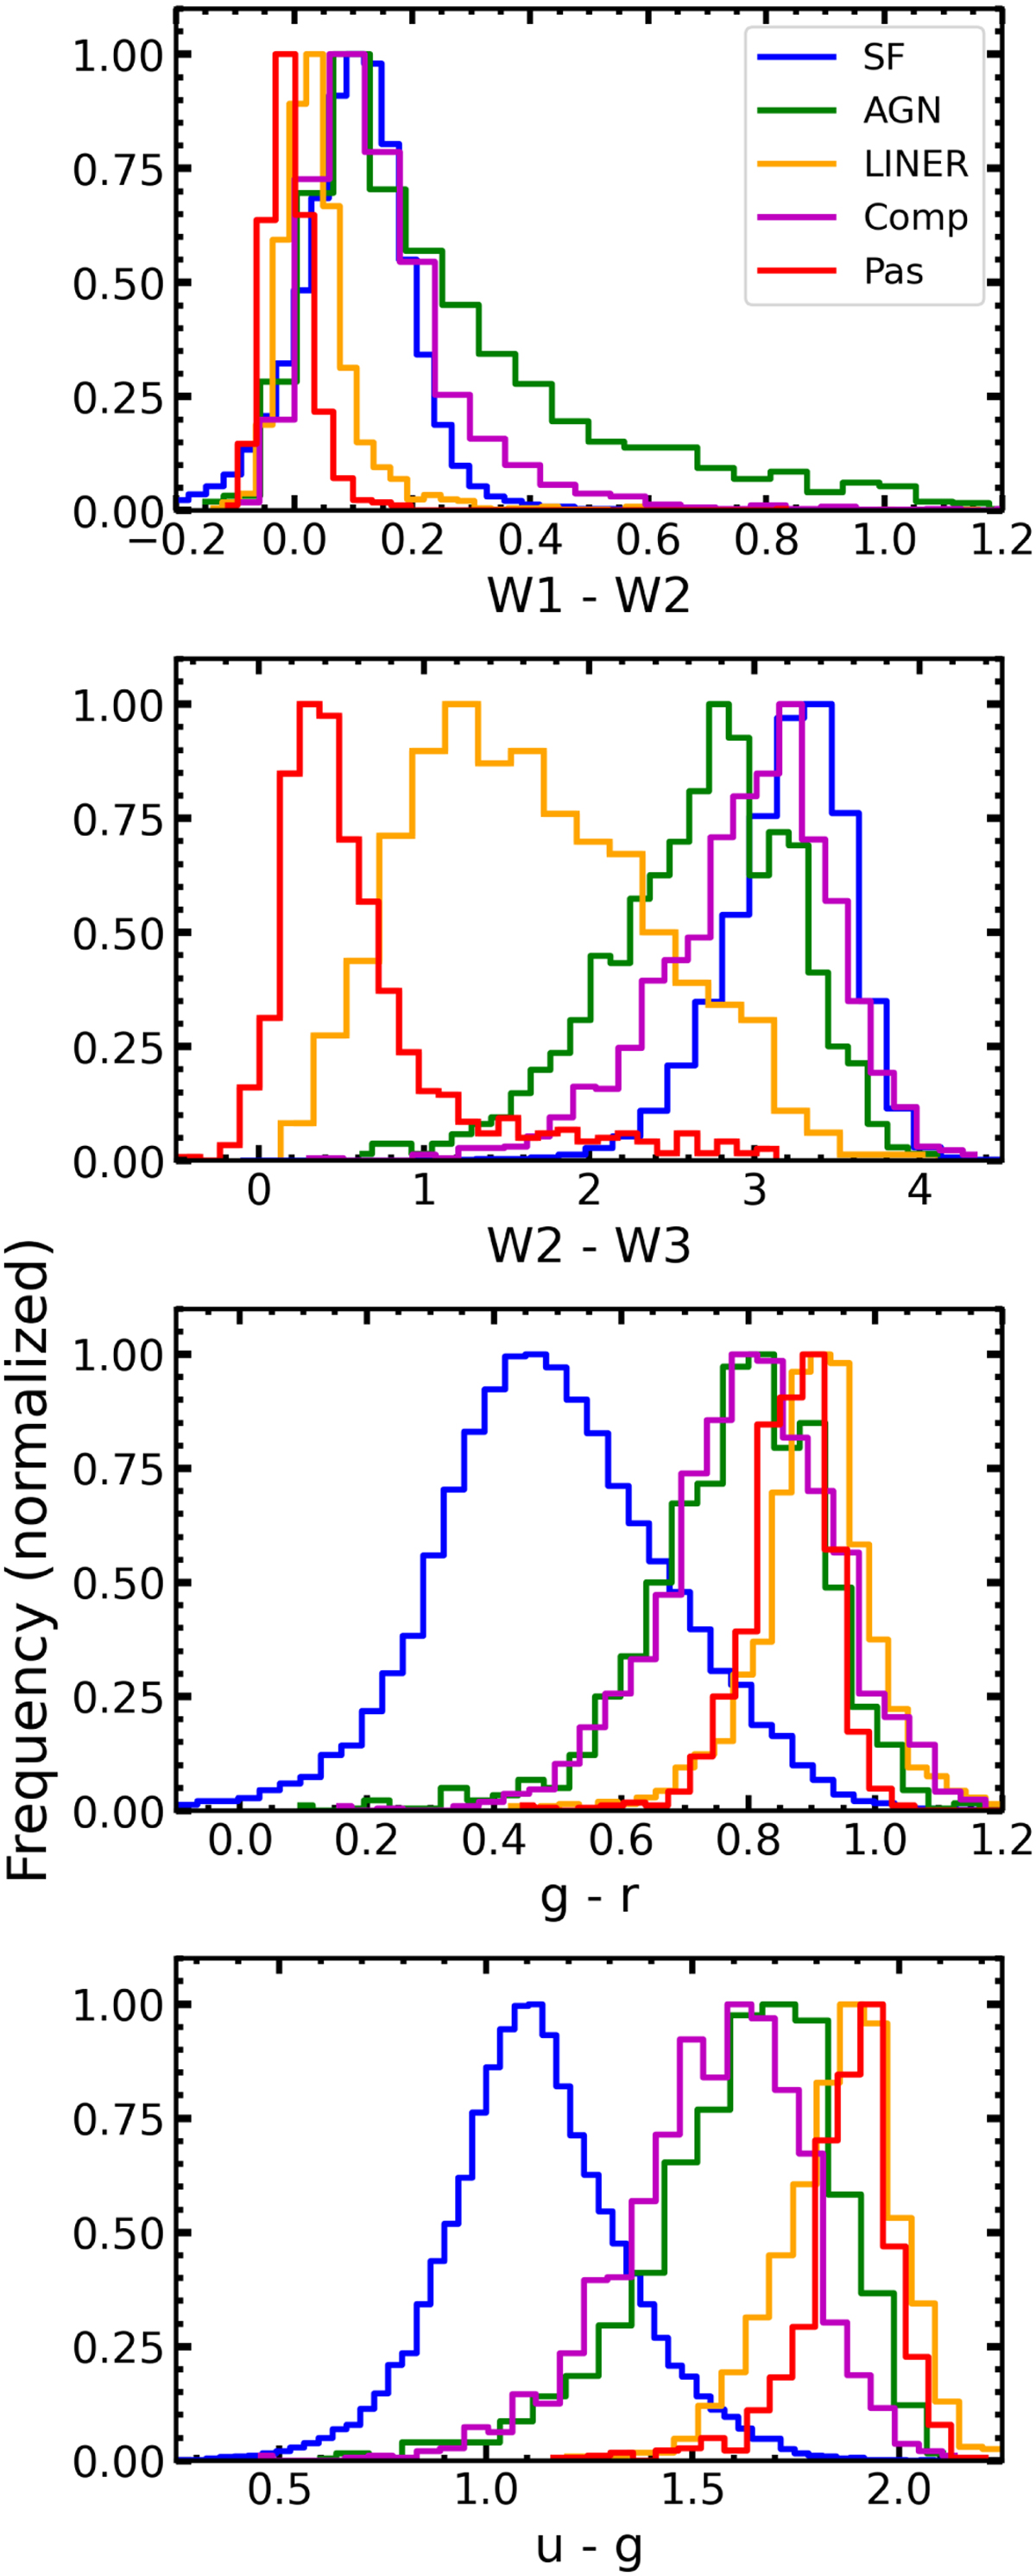
Distributions of colors considered as potential features for the definition of our diagnostic tool. Starting from top to bottom, we see the distributions of colors W1–W2, W2–W3, g–r, and u–g for each galactic activity class. Combinations of these four colors are used as potential feature schemes for defining our diagnostic. Due to the high imbalance of the sample, the number of galaxies is normalized based on the frequency of occurrence in our data sample. Blue histograms correspond to the SF, green to the AGN, yellow to LINER, purple to composite, and red to passive galaxies.
Current usage metrics show cumulative count of Article Views (full-text article views including HTML views, PDF and ePub downloads, according to the available data) and Abstracts Views on Vision4Press platform.
Data correspond to usage on the plateform after 2015. The current usage metrics is available 48-96 hours after online publication and is updated daily on week days.
Initial download of the metrics may take a while.