Fig. A.1
Download original image
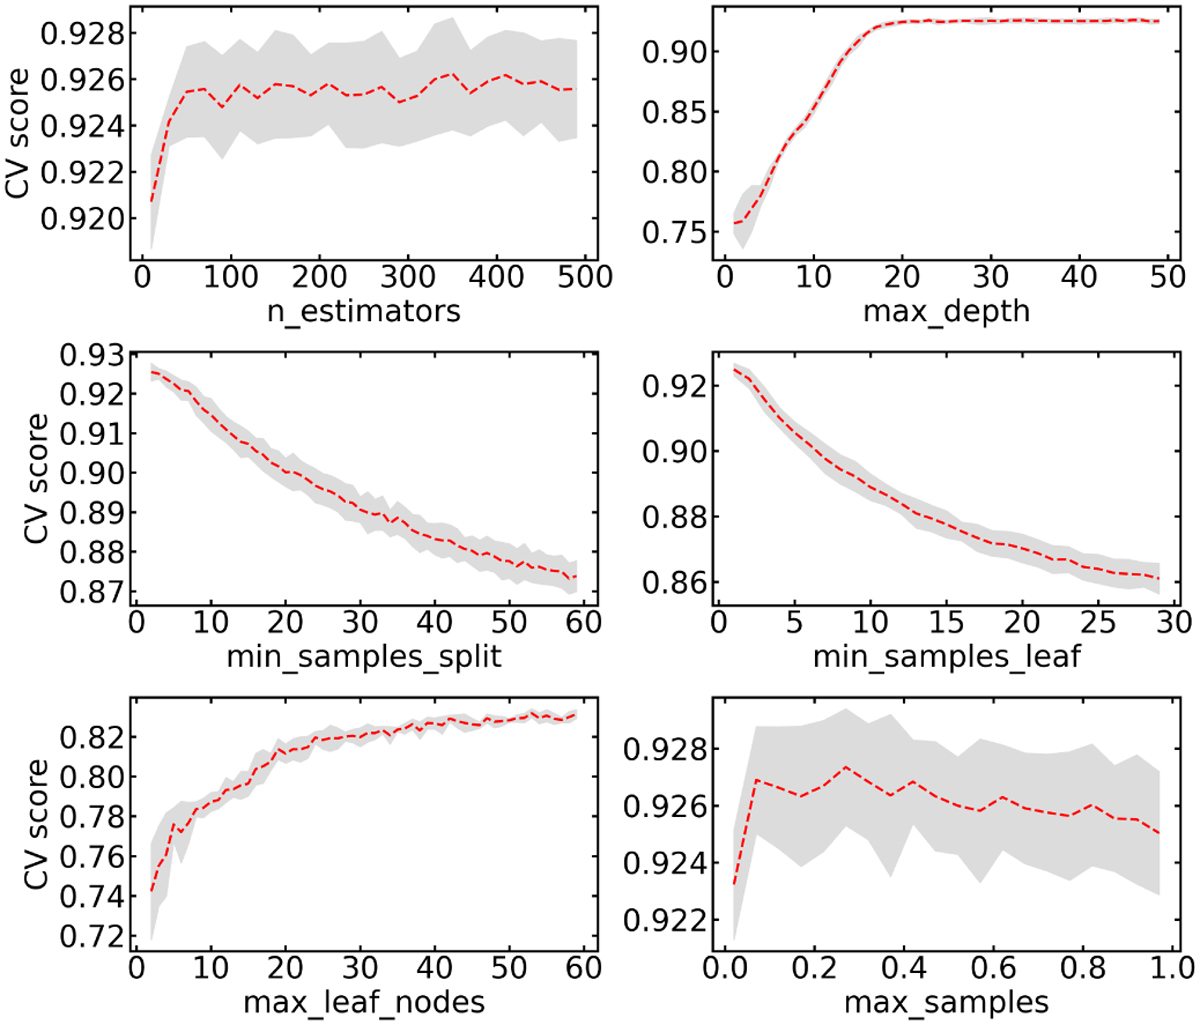
Validation curves for the determination of the best hyperparameter ranges for reducing the possible values of each hyperparameter. The CV scores refer to accuracy as a function of each hyperparameter. The red line is the average accuracy calculated using the k-fold CV method (k = 5), while the shaded gray area is the standard deviation (1σ) of the k-scores for each value of the hyperparameter under examination.
Current usage metrics show cumulative count of Article Views (full-text article views including HTML views, PDF and ePub downloads, according to the available data) and Abstracts Views on Vision4Press platform.
Data correspond to usage on the plateform after 2015. The current usage metrics is available 48-96 hours after online publication and is updated daily on week days.
Initial download of the metrics may take a while.