Fig. 13
Download original image
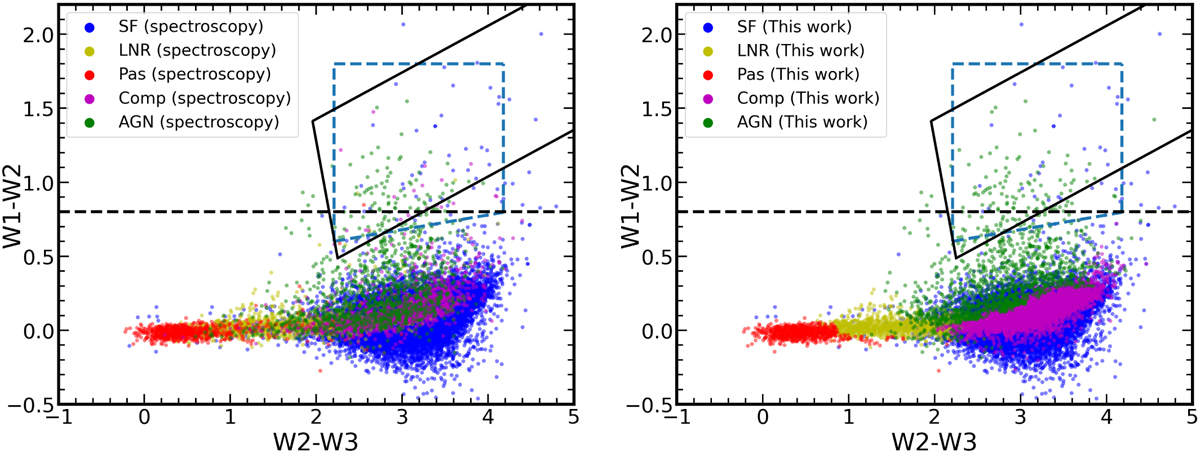
Color-color plots of W1–W2 against W2–W3 for our sample of galaxies. Left: galaxies based on their spectroscopic classification (true class). Right: same but for galaxies whose class labels were assigned by the new diagnostic tool. The solid black line is the locus of AGN galaxies as defined by Mateos et al. (2012), while the dashed black line is the demarcation line between an AGN and a non-AGN galaxy as defined by Stern et al. (2012). The dashed blue lines define the AGN galaxy selection box as defined by Jarrett et al. (2011). SF galaxies are shown in blue, LINER in yellow, passive in red, composite in purple, and AGN in green. Labels in the legend are the same as in Fig. 9. We see that there is a significant population of spectroscopic AGN galaxies located below the existing infrared diagnostics, which are correctly identified with our diagnostic. There is also a population of extreme SF galaxies located in the AGN locus of the existing AGN diagnostics that are also correctly classified by our diagnostic.
Current usage metrics show cumulative count of Article Views (full-text article views including HTML views, PDF and ePub downloads, according to the available data) and Abstracts Views on Vision4Press platform.
Data correspond to usage on the plateform after 2015. The current usage metrics is available 48-96 hours after online publication and is updated daily on week days.
Initial download of the metrics may take a while.