Fig. 12
Download original image
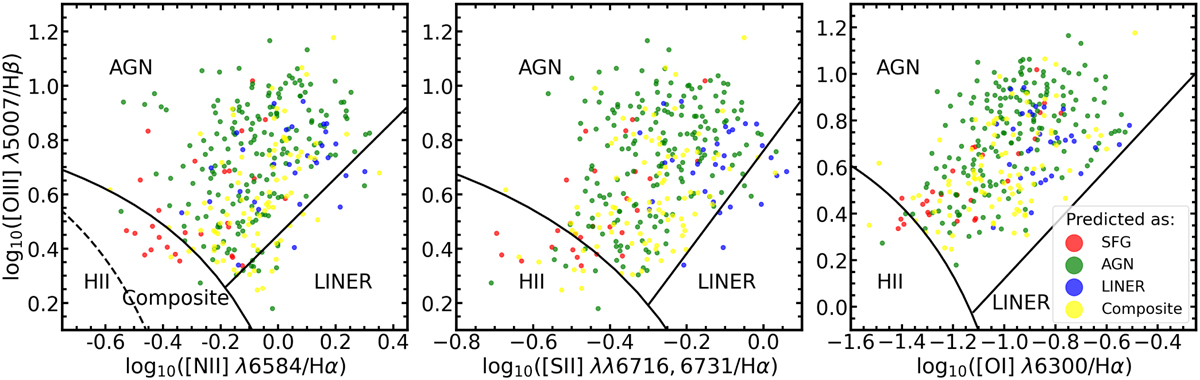
Diagrams of [O III] λ5007/Hβ against [N II] λ6584/Hα (left), [S II] λλ6716,6731/Hα (middle), and [O I] λ6300/Hα (right), showing the location of an optically selected sample of AGN galaxies from our test sample (Sect. 4.1). The points are color-coded depending on their classification based on our diagnostic: AGN in green, SF in red, LINER in blue, and composite in yellow. We see that, since these are two-dimensional projections of the four-dimensional space used for the optical line-ratio classification, some AGN galaxies may fall outside the AGN demarcation line. The solid black curve is the extreme starburst line defined by Kewley et al. (2001). The straight black line is the separating line between AGN and LINER galaxies as defined by Schawinski et al. (2007). The dashed black curve is the Kauffmann et al. (2003) line separating SF from composite galaxies.
Current usage metrics show cumulative count of Article Views (full-text article views including HTML views, PDF and ePub downloads, according to the available data) and Abstracts Views on Vision4Press platform.
Data correspond to usage on the plateform after 2015. The current usage metrics is available 48-96 hours after online publication and is updated daily on week days.
Initial download of the metrics may take a while.