Fig. 11
Download original image
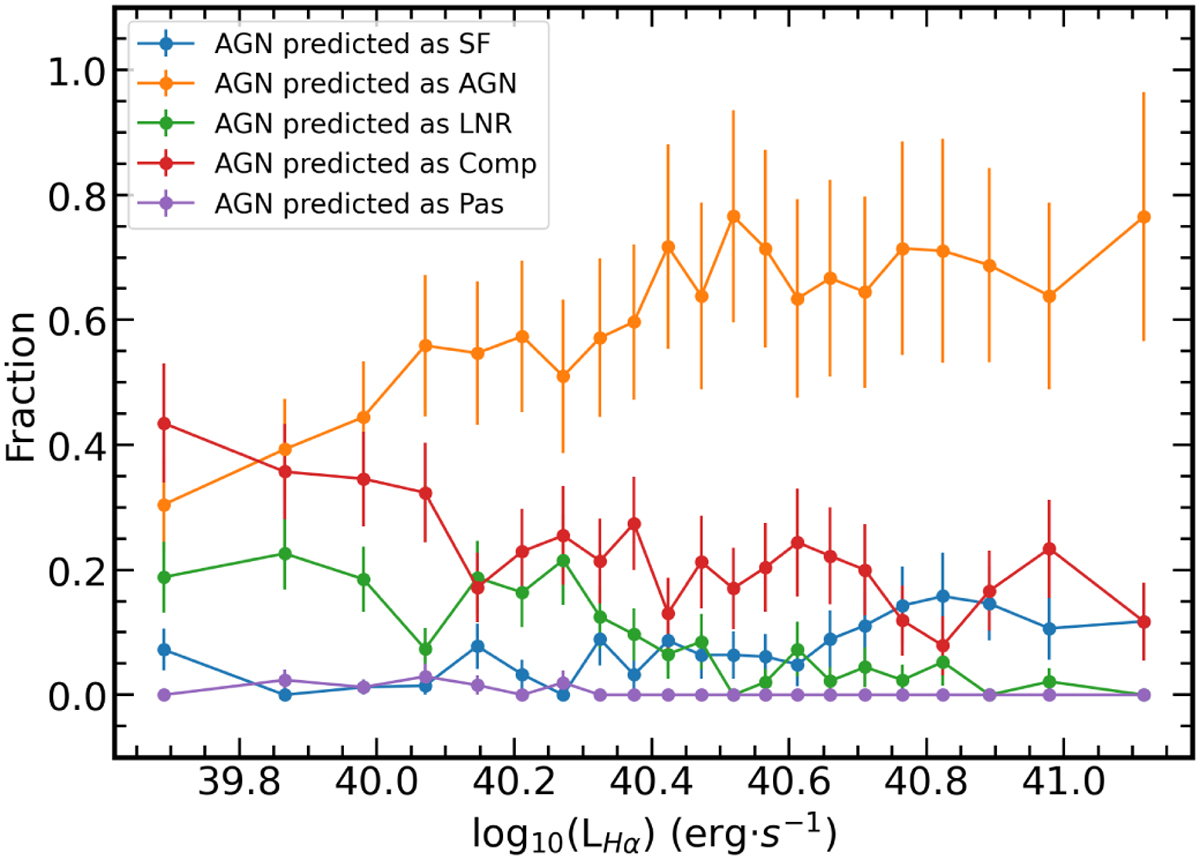
Fraction of the correctly identified AGN galaxies (true positives) to the total true AGN galaxies (i.e., a measure of recall or "completeness") as a function of the AGN Ha luminosity for all spectroscopically selected AGN galaxies in our sample (orange line). All other colored lines represent the fraction of true AGN galaxies that the diagnostic predicted to belong to a class other than AGN (false negatives) to the total true AGN (blue, SF; green, LINER; red, composite; purple, passive). All fractions were calculated after the galaxies were split into bins of increasing Ha luminosity that contain the same number of galaxies.
Current usage metrics show cumulative count of Article Views (full-text article views including HTML views, PDF and ePub downloads, according to the available data) and Abstracts Views on Vision4Press platform.
Data correspond to usage on the plateform after 2015. The current usage metrics is available 48-96 hours after online publication and is updated daily on week days.
Initial download of the metrics may take a while.