Fig. 8.
Download original image
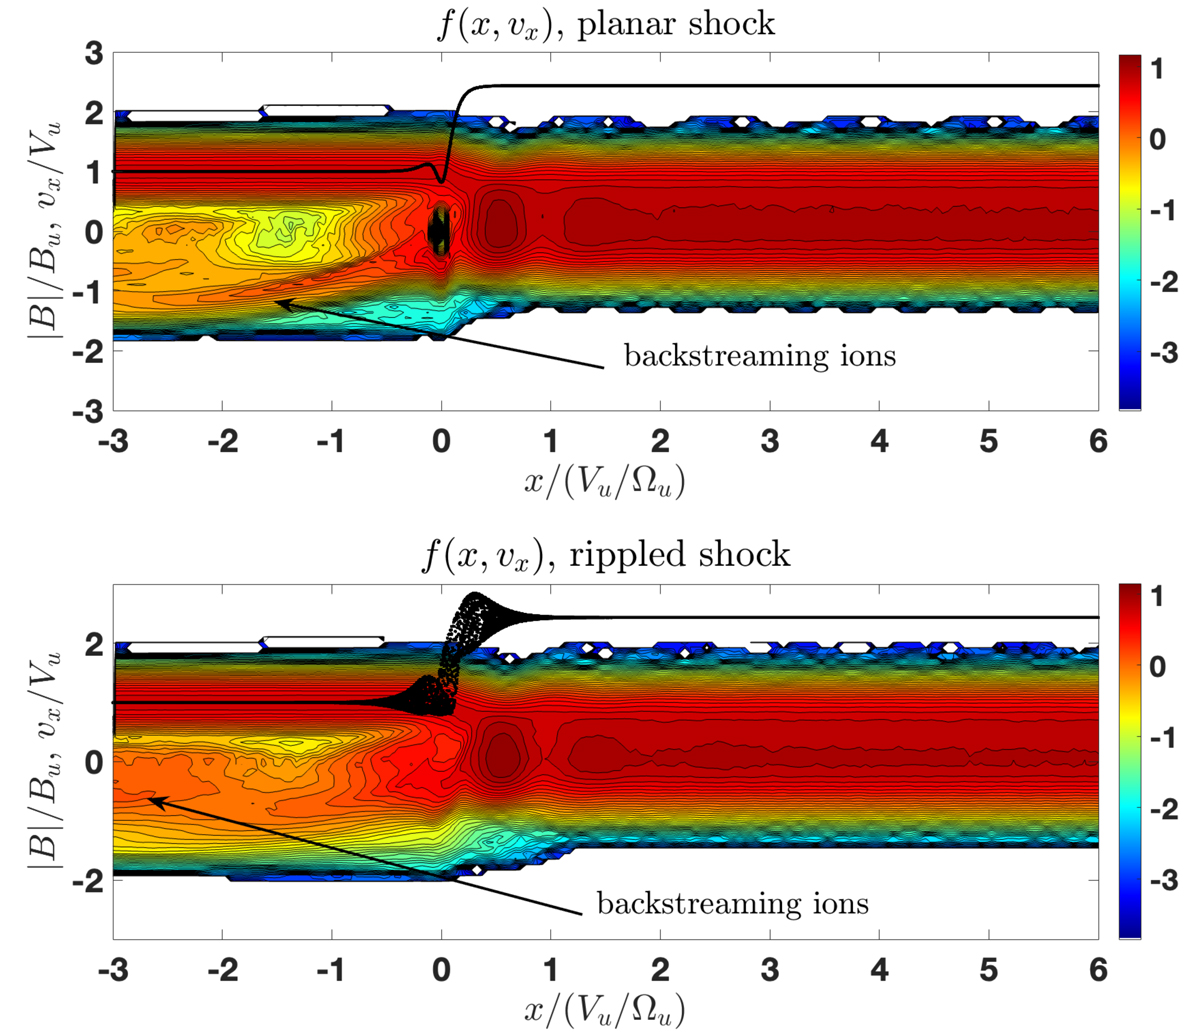
Test-particle analysis of a planar and rippled shock. Top: reduced distribution f(x, vx) of ions obtained with a test-particle analysis in a planar shock. The solid black line shows the magnetic field profile. The arrow points to the backstreaming ions. Bottom: reduced distribution f(x, vx) of ions obtained with a test-particle analysis in a rippled shock. The magnetic profile is represented by a ribbon because each ion measures its magnetic field magnitude along its path.
Current usage metrics show cumulative count of Article Views (full-text article views including HTML views, PDF and ePub downloads, according to the available data) and Abstracts Views on Vision4Press platform.
Data correspond to usage on the plateform after 2015. The current usage metrics is available 48-96 hours after online publication and is updated daily on week days.
Initial download of the metrics may take a while.