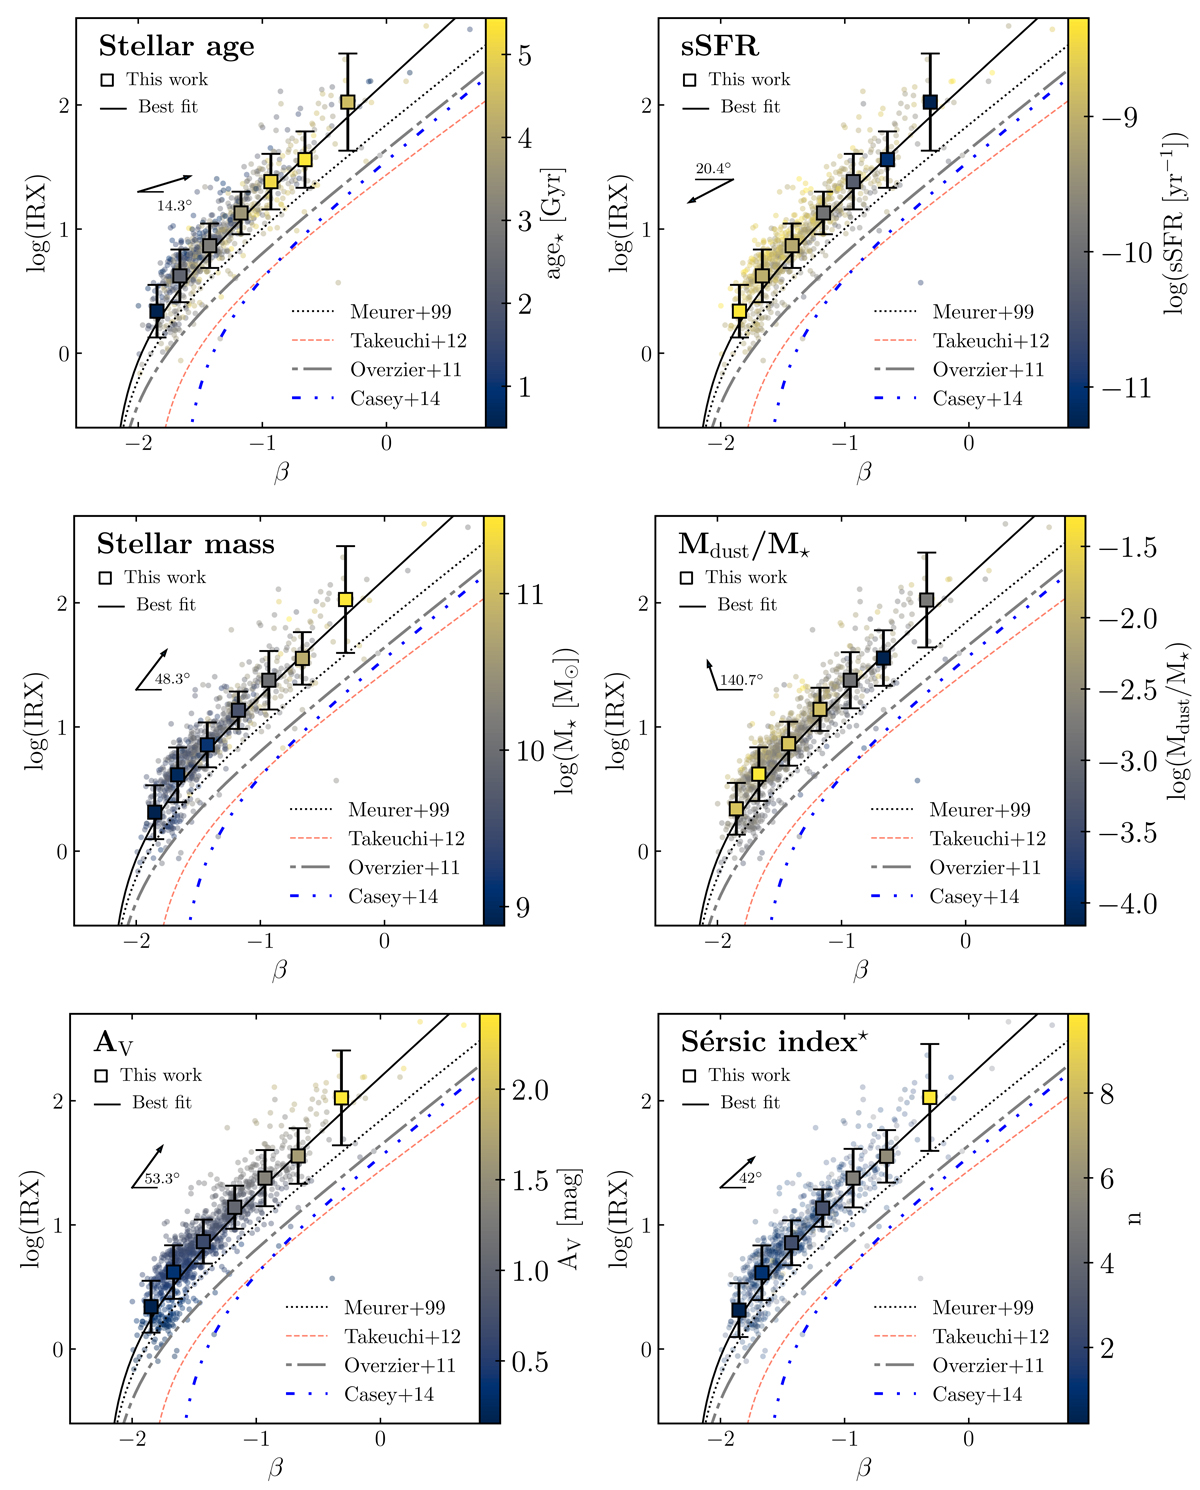
Fig. 8.
Download original image
IRX–β binned scatter of our sample color-coded with different physical properties. Squares denote the VIPERS sample binned by β, every bin contains the same number of galaxies (160 galaxies), except the last bin (containing 89 galaxies). The original Meurer et al. (1999) fit is shown in dotted line. We also compare with fits from Overzier et al. (2011), Takeuchi et al. (2012), Casey et al. (2014), denoted with grey dashed-dotted, red dashed, and dashed-double-dotted lines, respectively. The solid black line shows Eq. (9), describing our sample. The arrows represent the direction of the trend, starting from the mean of the bottom 30th percentile of the distribution up to that of the top 70th percentile of a given quantity, they are meant to show the general direction of the trend. The lower right figure with the Sérsic index, a total of 823 galaxies (instead of 1049) are binned, due to GALFIT flag selection, based on Krywult et al. (2017). The angles are between the arrows and the x or y axis.
Current usage metrics show cumulative count of Article Views (full-text article views including HTML views, PDF and ePub downloads, according to the available data) and Abstracts Views on Vision4Press platform.
Data correspond to usage on the plateform after 2015. The current usage metrics is available 48-96 hours after online publication and is updated daily on week days.
Initial download of the metrics may take a while.