Fig. 4.
Download original image
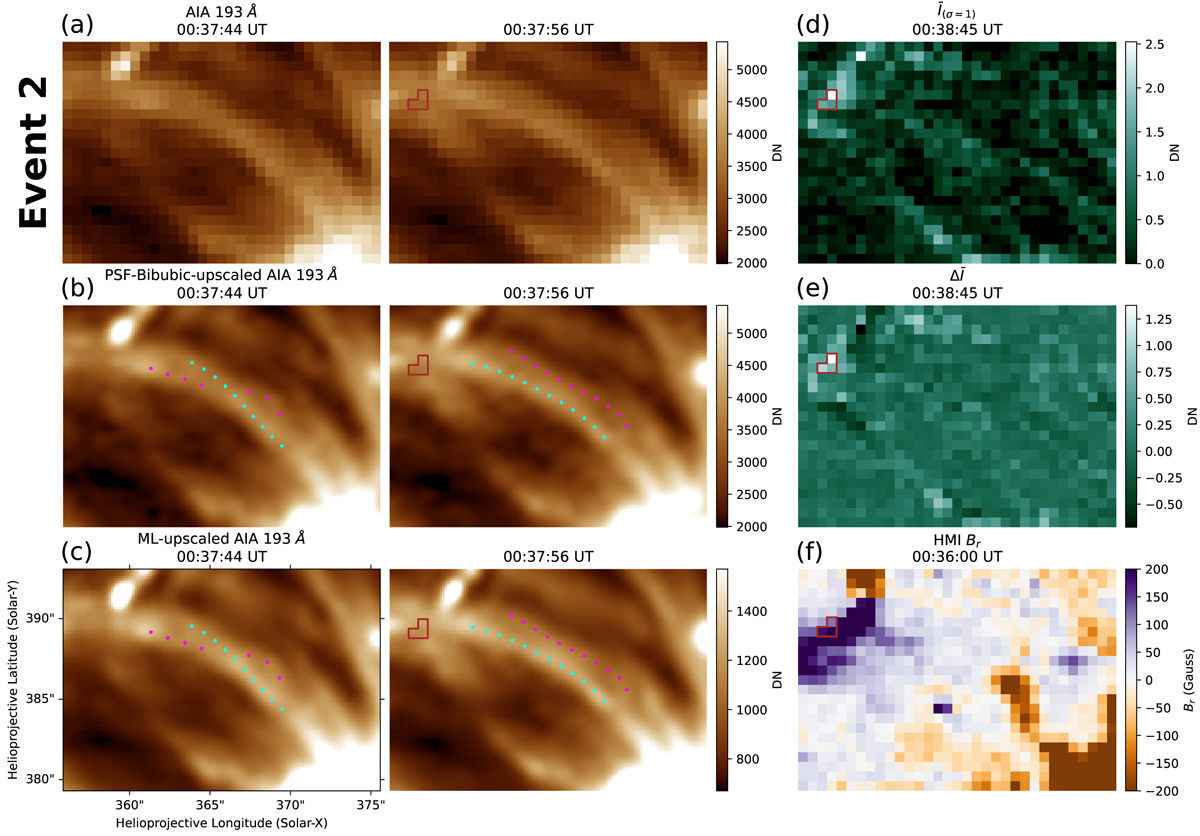
Evolution of the braiding strands on 22 June 2010 (Event 2). Panel a: SDO/AIA 193 Å images. Panels b–c: bicubic-upscaled versions of the PSF-matched AIA 193 Å images and ML-upscaled versions of the AIA 193 Å images, on which the various coloured dotted lines indicate the various recognizable strands. Panels d–e: images of ![]() and
and ![]() , where the
, where the ![]() and
and ![]() are the Fe XVIII intensity of I(94 Å) − I(211 Å)/120 − I(171 Å))/450 smoothed with a Gaussian kernel of 1 and 4 min, respectively. These images were taken at the peak time of the hot emission indicated by the brown box in panel d, which is only one hot emission identified from 00:35:08 UT to 00:45:08 UT. The brown box is also plotted in the other panels. Panel f: vertical component (Br) of the photospheric vector data from SDO/HMI. All images have the same FOV. The evolution of the braiding strands is shown in a movie (anim4.mpeg) available online.
are the Fe XVIII intensity of I(94 Å) − I(211 Å)/120 − I(171 Å))/450 smoothed with a Gaussian kernel of 1 and 4 min, respectively. These images were taken at the peak time of the hot emission indicated by the brown box in panel d, which is only one hot emission identified from 00:35:08 UT to 00:45:08 UT. The brown box is also plotted in the other panels. Panel f: vertical component (Br) of the photospheric vector data from SDO/HMI. All images have the same FOV. The evolution of the braiding strands is shown in a movie (anim4.mpeg) available online.
Current usage metrics show cumulative count of Article Views (full-text article views including HTML views, PDF and ePub downloads, according to the available data) and Abstracts Views on Vision4Press platform.
Data correspond to usage on the plateform after 2015. The current usage metrics is available 48-96 hours after online publication and is updated daily on week days.
Initial download of the metrics may take a while.