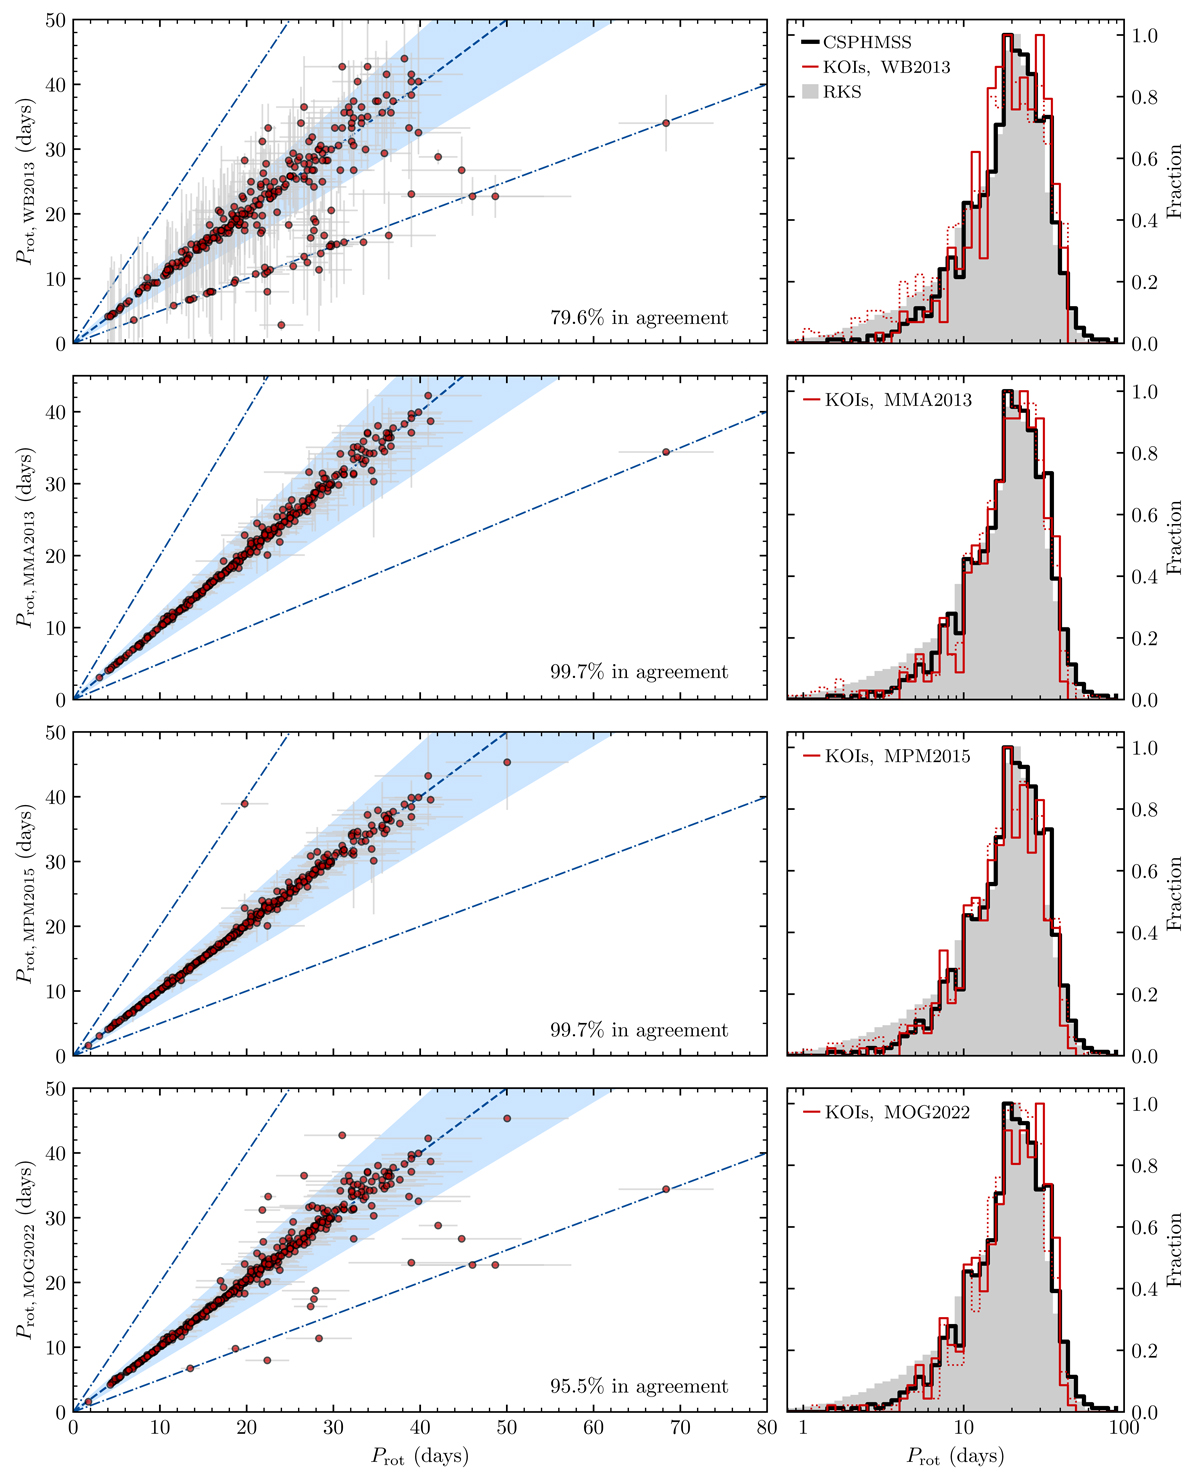
Fig. D.1.
Download original image
Comparison between the Prot estimates from the literature and from this work. Left:Prot from the literature as a function of Prot from this work. The blue dashed and dot-dashed lines are the 1-1, 2-1, and 1-2 lines. In each panel the percentage of common targets in agreement is indicated. The Prot estimates are considered to be in agreement if they are within 20% (blue shaded region). Right: Comparison between the Prot distributions for the RKS (shaded grey region); CSPHMSS (thick black line); and the KOIs in the literature (red line). The solid red line shows the distributions only for the confirmed planet hosts, with only one known exoplanet, in the main sequence and single. The dotted histograms show the distributions for the original samples in each study (all system types considered).
Current usage metrics show cumulative count of Article Views (full-text article views including HTML views, PDF and ePub downloads, according to the available data) and Abstracts Views on Vision4Press platform.
Data correspond to usage on the plateform after 2015. The current usage metrics is available 48-96 hours after online publication and is updated daily on week days.
Initial download of the metrics may take a while.