Fig. 2.
Download original image
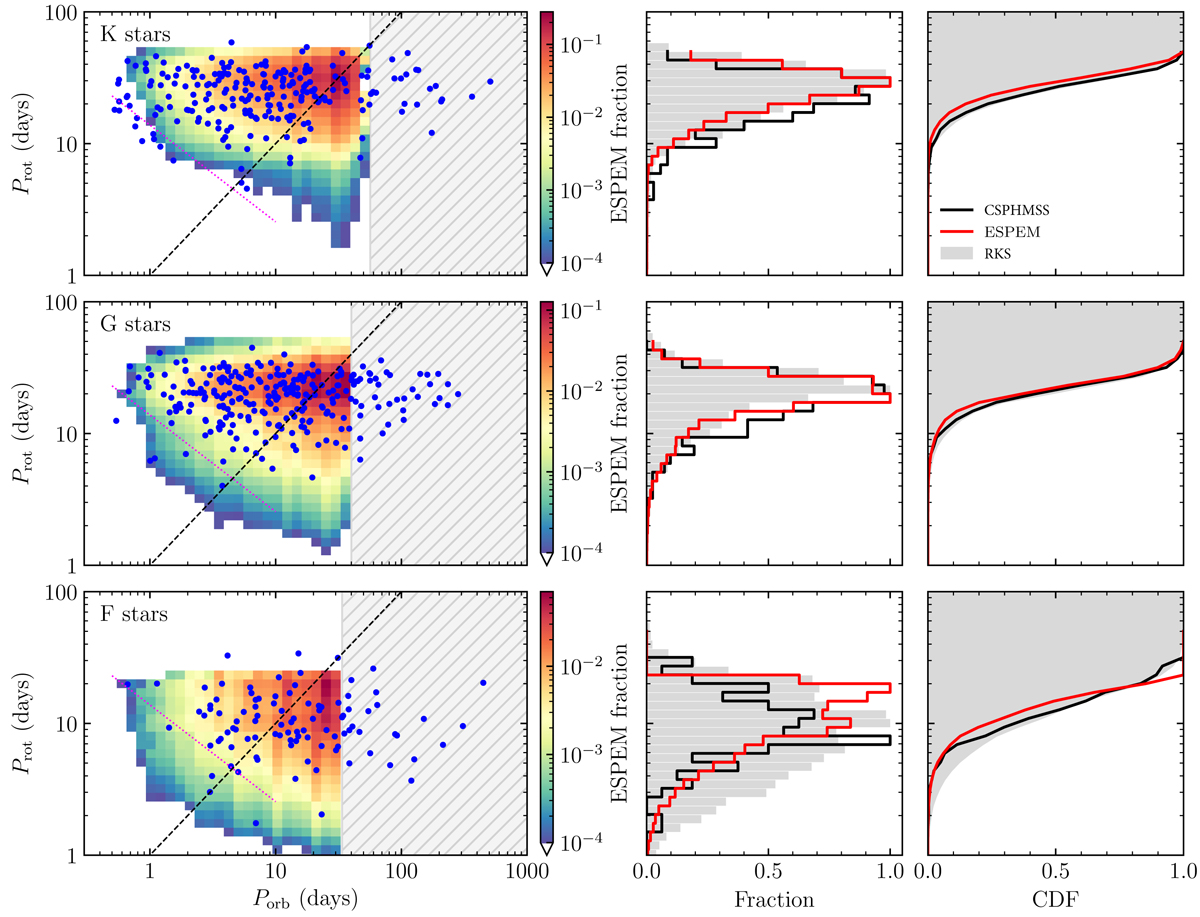
Prot vs Porb per spectral type (K-, G-, and F-type stars from top to bottom, left panels). The coloured regions depict the distribution of star-planet occurrences computed with ESPEM, while the blue dots are the CSPHMSS. The grey shaded region indicates the parameter space not covered by the simulation. The dotted and dashed lines are the same as in Fig. 1. The middle and right panels correspond to the Prot histograms and CDFs, respectively, for the three distribution of stars: CSPHMSS (black), ESPEM (red), and RKS (grey).
Current usage metrics show cumulative count of Article Views (full-text article views including HTML views, PDF and ePub downloads, according to the available data) and Abstracts Views on Vision4Press platform.
Data correspond to usage on the plateform after 2015. The current usage metrics is available 48-96 hours after online publication and is updated daily on week days.
Initial download of the metrics may take a while.