Fig. 5
Download original image
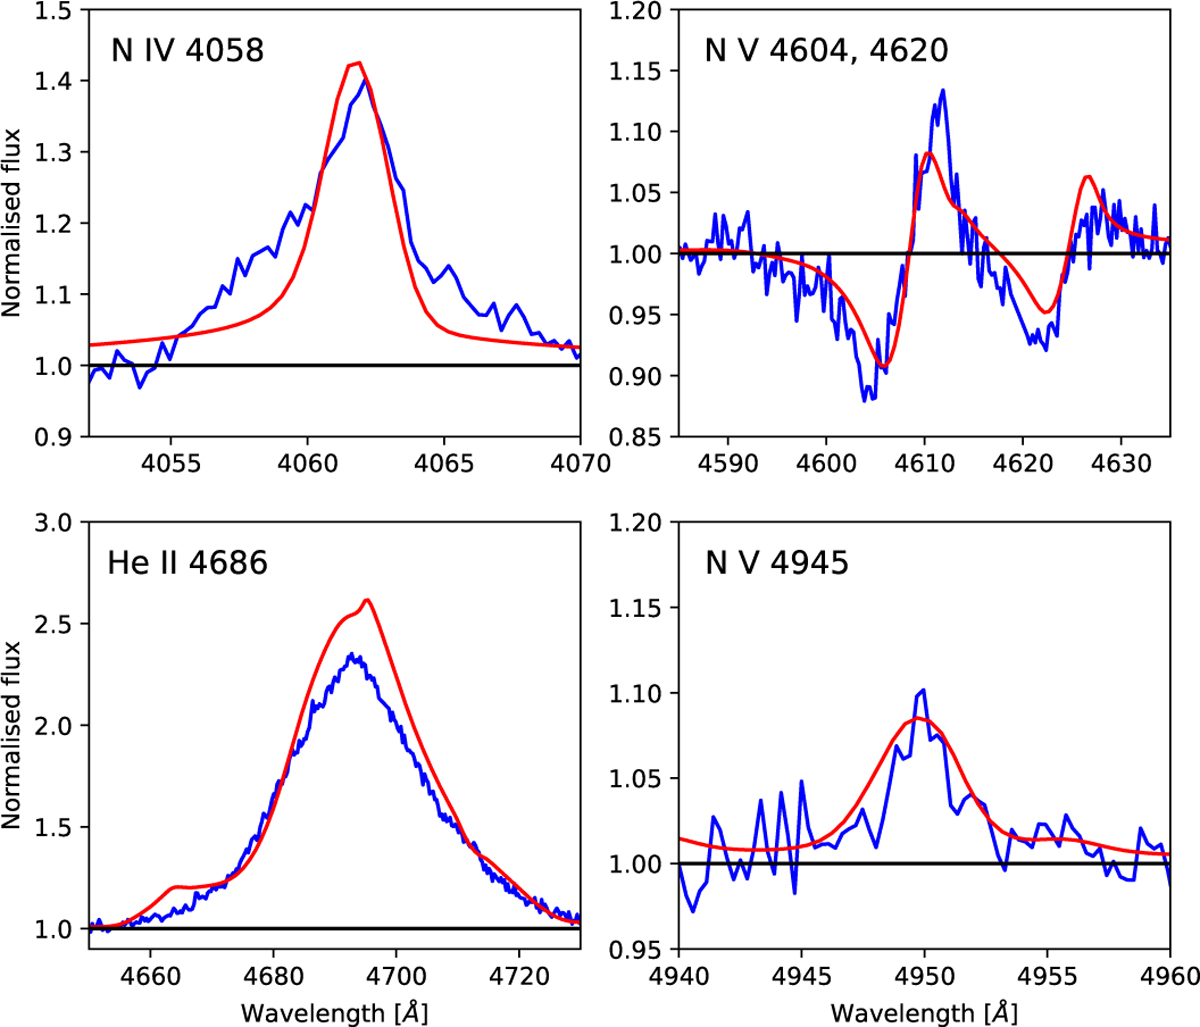
Comparison between the synthetic PoWR model (solid red line) used for cross-correlation and the normalised spectrum of al taken in March 2020 (noisy blue line). The line profiles of the PoWR model were shifted by 330 km s−1, and the EWs of the N IV λ4058 and Ν Vλ4945 proflies were scaled to the observations for the sake of plotting (the EW has no impact on the cross-correlation algorithm). The spectra of a2, a3, and с are comparable, and so is the match between the model and the data.
Current usage metrics show cumulative count of Article Views (full-text article views including HTML views, PDF and ePub downloads, according to the available data) and Abstracts Views on Vision4Press platform.
Data correspond to usage on the plateform after 2015. The current usage metrics is available 48-96 hours after online publication and is updated daily on week days.
Initial download of the metrics may take a while.