Open Access
Fig. 4
Download original image
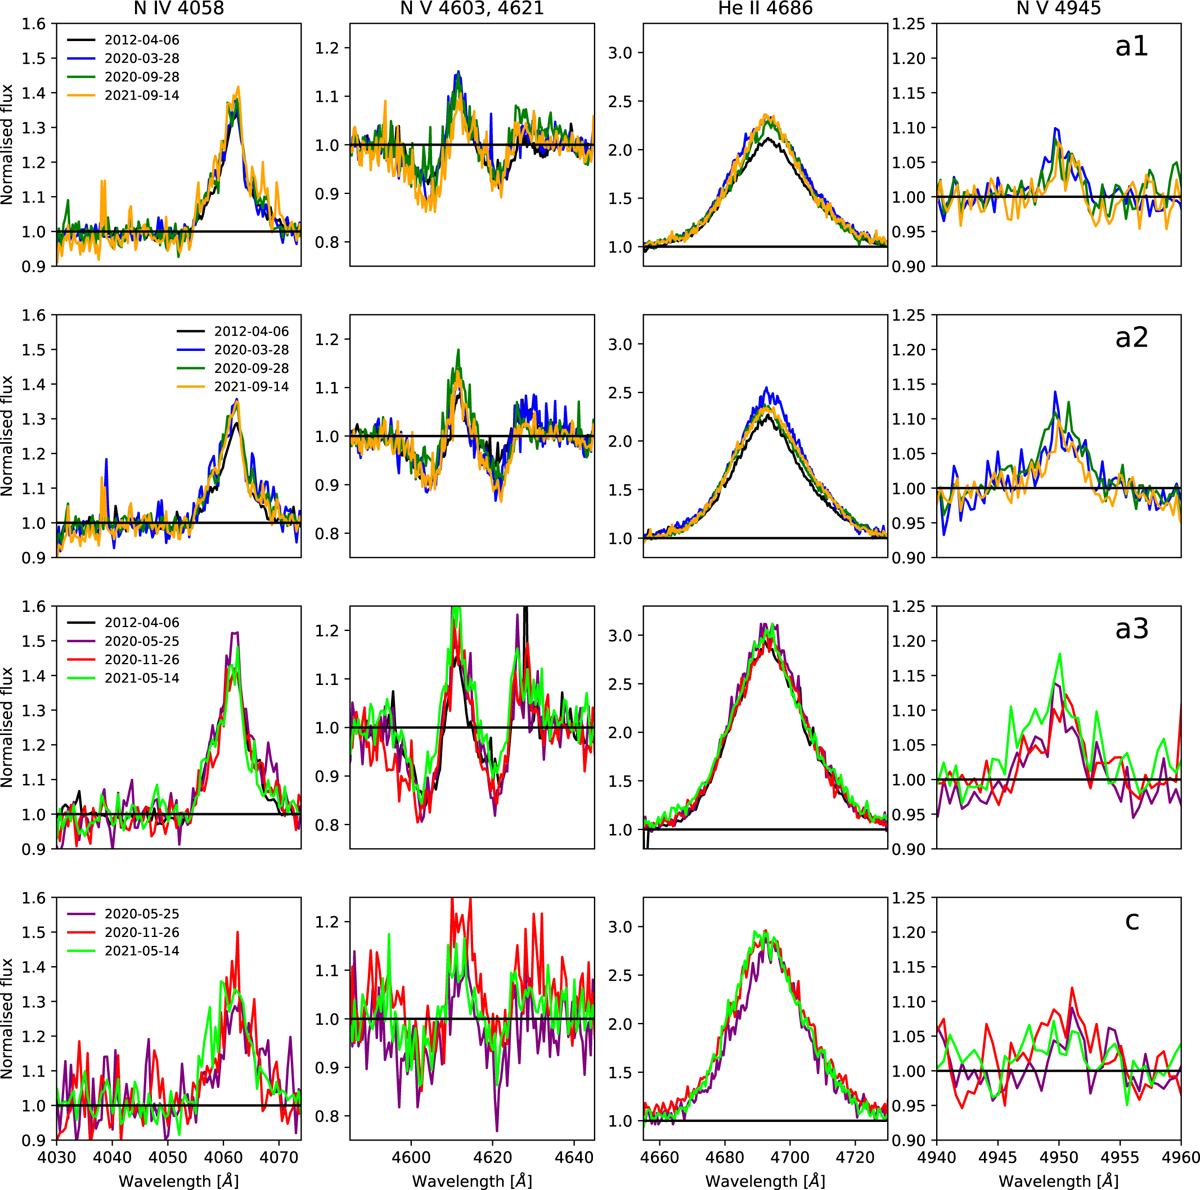
Extracted STIS spectra for a1, a2, a3, and c (from top to bottom), focusing on the diagnostic lines N IV λ4058, N V λλ4604,4620, He II λ4686, and N V λ4945 (from left to right). Epochs are listed in the legends. The spectra of a3 and c are binned at ∆λ = 0.5 Å for clarity.
Current usage metrics show cumulative count of Article Views (full-text article views including HTML views, PDF and ePub downloads, according to the available data) and Abstracts Views on Vision4Press platform.
Data correspond to usage on the plateform after 2015. The current usage metrics is available 48-96 hours after online publication and is updated daily on week days.
Initial download of the metrics may take a while.