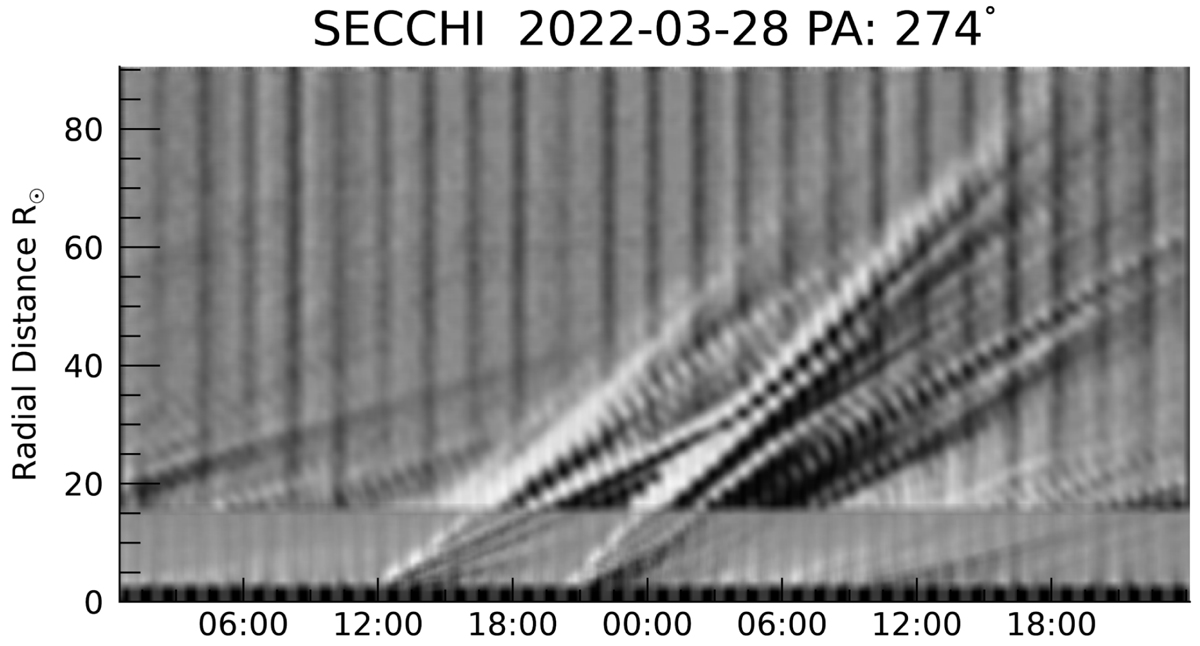
Fig. 7.
Download original image
SECCHI height vs. time map for 28 and 29 March. The map is generated by taking a strip of images at a given position angle, in this case, 274° from solar north, and stacking each time step together. The position angle differs from the SoloHI position angle in Fig. 6 because the observers on the different spacecraft observe from opposite directions. The y-axis is the radial distance in R⊙.
Current usage metrics show cumulative count of Article Views (full-text article views including HTML views, PDF and ePub downloads, according to the available data) and Abstracts Views on Vision4Press platform.
Data correspond to usage on the plateform after 2015. The current usage metrics is available 48-96 hours after online publication and is updated daily on week days.
Initial download of the metrics may take a while.