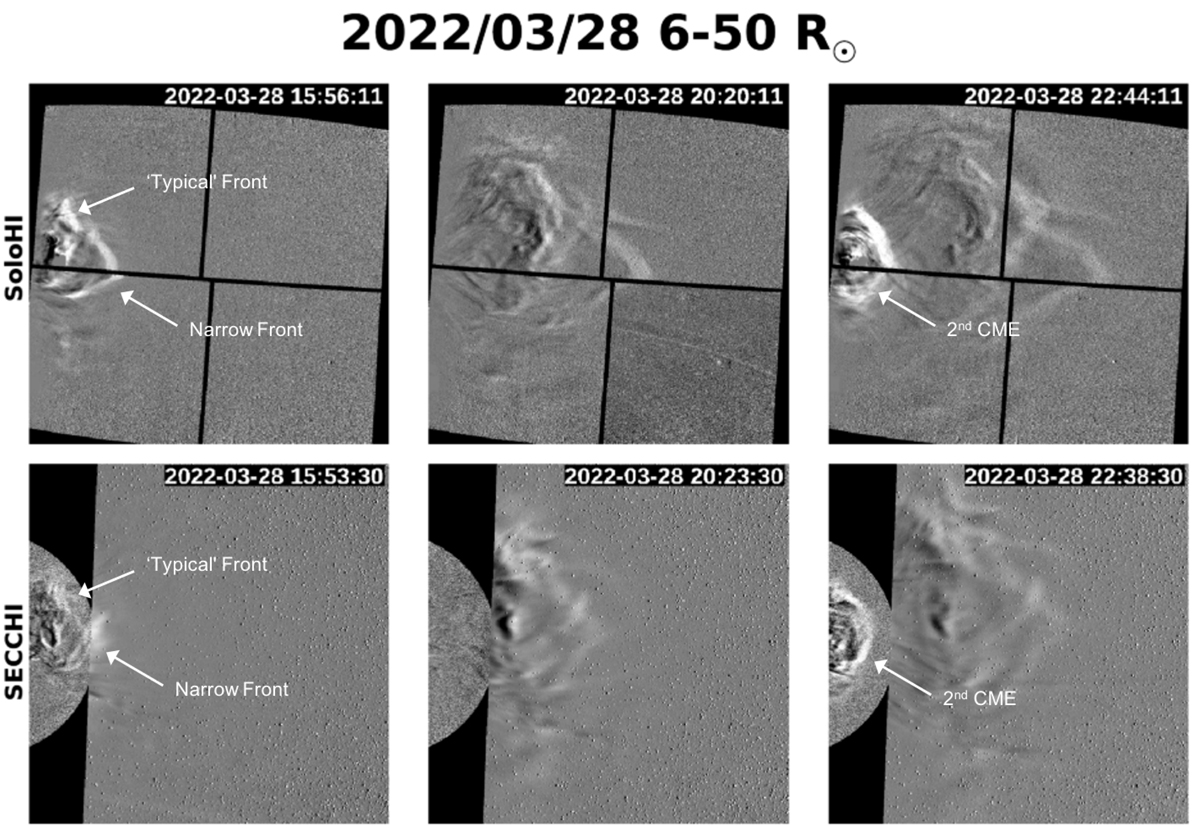
Fig. 4.
Download original image
Roughly cotemporal images of the 28 March CME from SoloHI and the SECCHI instrument suite. To highlight the common FoV, images from all SoloHI tiles and COR2 and HI1 are projected onto identical grids, covering 6–50 R⊙ in the radial direction and −22 to 22 R⊙ in the y-direction. The SoloHI images are flipped from their standard viewing direction to facilitate comparison. All images from every instrument are processed with a running ratio byte-scaled to a range of 0.98–1.02. The times given in the SoloHI frames correspond to the time of the tile 1 image, and the other tiles are the closest frame to that tile 1 image. Similarly, SECCHI times are based on COR2 timing, and the closest HI1 frame was selected. Late in the day, the second CME becomes visible at the inner part of the FoV. Movies of the projected fields of view used to generate these panels are provided online for both SECCHI and SoloHI, covering the entire period of 28 March to April 2.
Current usage metrics show cumulative count of Article Views (full-text article views including HTML views, PDF and ePub downloads, according to the available data) and Abstracts Views on Vision4Press platform.
Data correspond to usage on the plateform after 2015. The current usage metrics is available 48-96 hours after online publication and is updated daily on week days.
Initial download of the metrics may take a while.