Fig. 9.
Download original image
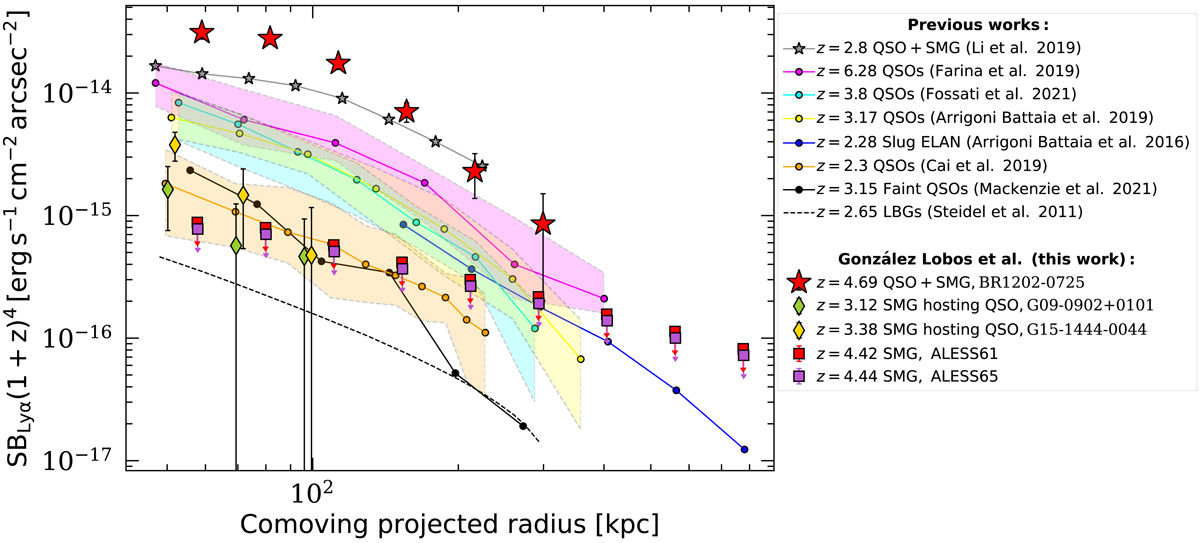
Circularly averaged SB as a function of comoving projected radius of the nebulae detected in our QSO sample (red stars, green diamonds, and yellow diamonds for BR1202 − 0725, G09 − 0902 + 0101, and G15 − 1444 − 0044, respectively), corrected for cosmological dimming. The red and purple squares with arrows indicate the upper limits for ALESS61.1 and ALESS65.1, respectively. Different profiles from the literature are indicated as colored circles with their respective 25 − 75 percentile ranges when available. The z = 3.17 QSO sample from Arrigoni Battaia et al. (2019a) is shown in yellow. The SB profile (taken from Arrigoni Battaia et al. 2016) of the z = 2.28 Slug ELAN is shown in blue (Cantalupo et al. 2014). The z = 6.2 QSO sample from Farina et al. (2019) is shown in magenta. The z = 3.8 QSO sample from Fossati et al. (2021) is shown in cyan. The z = 2.3 QSO sample from Cai et al. (2019) is shown in orange. The median profile of the faint QSO sample at z = 3 from Mackenzie et al. (2021) is shown with black connected circles. We computed the SB profile of the galaxy group SMMJ02399, which comprises a QSO and an SMG at z = 2.8 from Li et al. (2019; gray connected circles). Finally, the fit to the observed SB profile for z = 2.65 LBGs from Steidel et al. (2011) is shown with the dashed black curve.
Current usage metrics show cumulative count of Article Views (full-text article views including HTML views, PDF and ePub downloads, according to the available data) and Abstracts Views on Vision4Press platform.
Data correspond to usage on the plateform after 2015. The current usage metrics is available 48-96 hours after online publication and is updated daily on week days.
Initial download of the metrics may take a while.