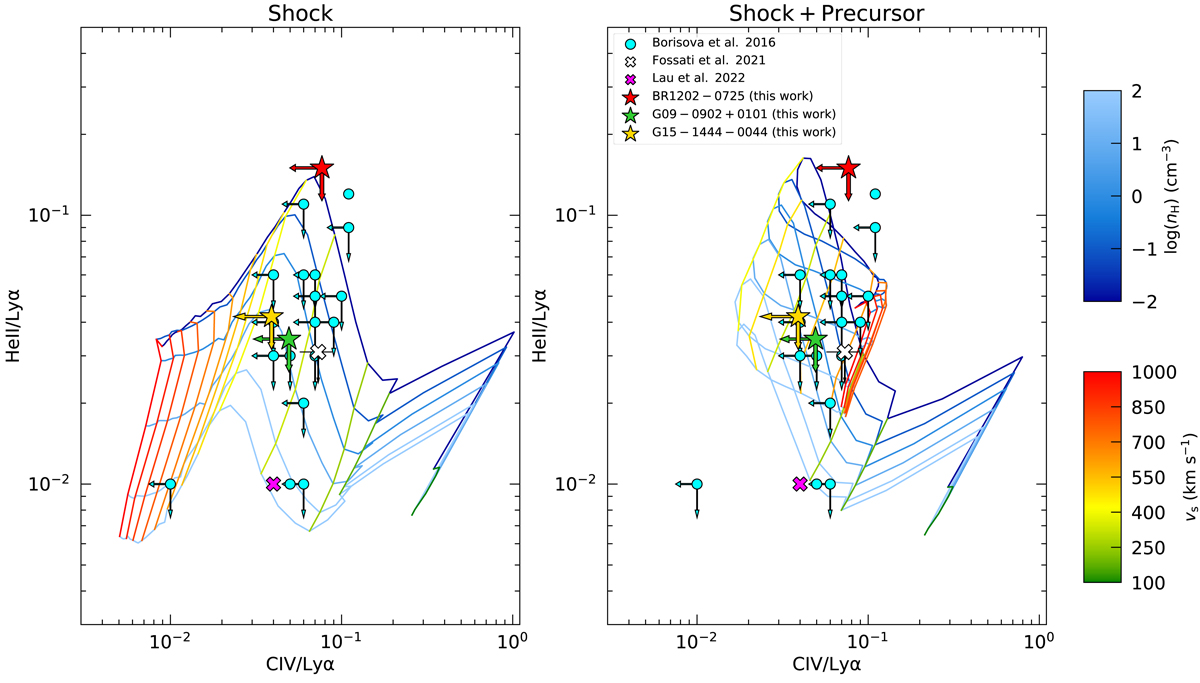
Fig. 8.
Download original image
C IV/Lyα and He II/Lyα line ratio upper limits (2σ) for the sources studied here with detected extended Lyα nebulae (star symbols). The line ratios are computed from the nebular luminosities listed in Table 3. The left panel shows the model grids for the shock scenario, while the right panel shows the model grids for the shock+precursor scenario from Allen et al. (2008). Overlaid are derived line ratios and upper limits for QSO nebulae from Borisova et al. (2016) as cyan circles, stacked nebulae around z = 3 − 4.5 QSOs inside a radial bin of 10 < R/kpc < 30 from Fossati et al. (2021) as a white cross, and one extremely red QSO at z ∼ 2.3 (Lau et al. 2022) as a magenta cross.
Current usage metrics show cumulative count of Article Views (full-text article views including HTML views, PDF and ePub downloads, according to the available data) and Abstracts Views on Vision4Press platform.
Data correspond to usage on the plateform after 2015. The current usage metrics is available 48-96 hours after online publication and is updated daily on week days.
Initial download of the metrics may take a while.