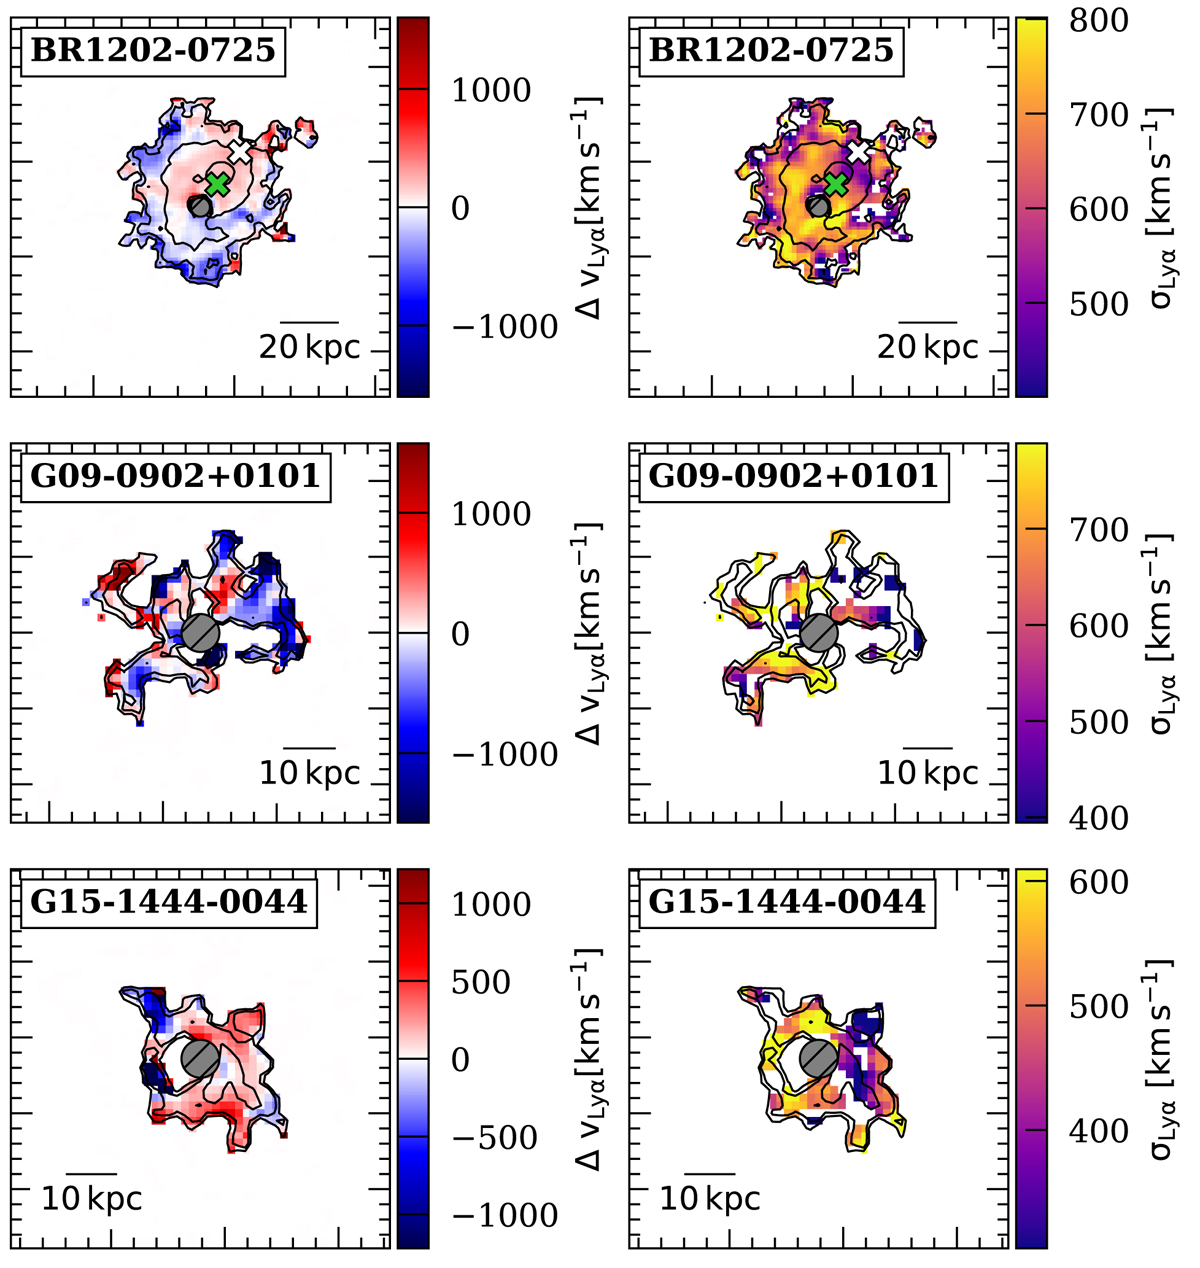
Fig. 5.
Download original image
Kinematics of the detected Lyα nebulae: Velocity shift ΔvLyα maps (left column) with respect to the Lyα peak wavelength of the nebula (see Fig. 2), and velocity dispersion σLyα maps (right column) of the Lyα nebula around the three QSOs, computed from the first and second moment, respectively. The maps are smoothed as in Fig. 2. The moment calculation is performed only inside the 2σ isophote of each nebula. The positions of the LAE and SMG companion of the BR1202-0725 system are marked with a green and white cross, respectively. The side of the map is 20″ for BR1202-0725 and 10″ for G09-0902+0101 and G15-1444-0044. A scale bar is shown for each map. The gray circle in each map indicates the 1 arcsec2 region used for the QSO’s PSF normalization, which is neglected in our analysis.
Current usage metrics show cumulative count of Article Views (full-text article views including HTML views, PDF and ePub downloads, according to the available data) and Abstracts Views on Vision4Press platform.
Data correspond to usage on the plateform after 2015. The current usage metrics is available 48-96 hours after online publication and is updated daily on week days.
Initial download of the metrics may take a while.