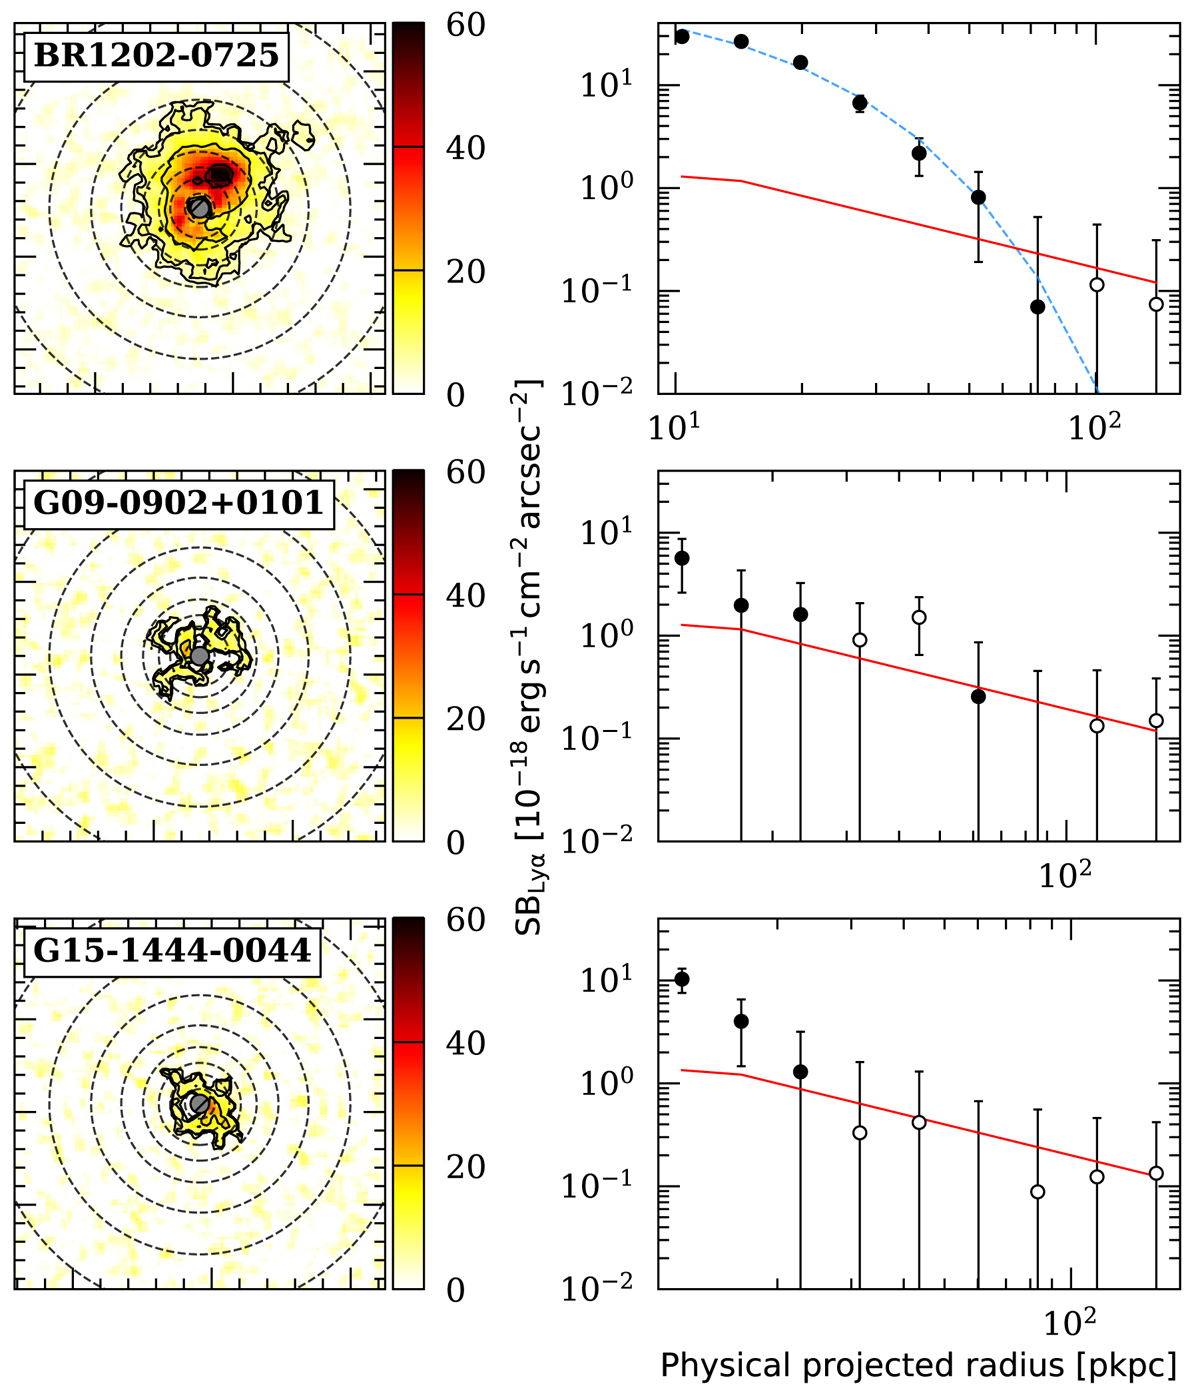
Fig. 4.
Download original image
Lyα SB radial profiles extraction. Left: smoothed SB maps of the QSO sample (same as in Fig. 2) with the circular apertures used to extract radial profiles overlaid. The gray circle in each map indicates the 1 arcsec2 region used for the QSO’s PSF normalization, which is neglected in our analysis. Right: extracted radial profiles inside each annulus. Open circles indicate negative values, shown here for completeness. The red line represents the 2σ SB limit rescaled to the area of each annulus. The dashed blue curve in the top panel is the best fit of the data points above the red line using an exponential function with the form SBLyα = Cexp( − r/rh), where C = 85.3 ± 13.8 × 10⁻¹⁸ erg s−1 cm−2 arcsec−2 and rh = 11 ± 1 pkpc.
Current usage metrics show cumulative count of Article Views (full-text article views including HTML views, PDF and ePub downloads, according to the available data) and Abstracts Views on Vision4Press platform.
Data correspond to usage on the plateform after 2015. The current usage metrics is available 48-96 hours after online publication and is updated daily on week days.
Initial download of the metrics may take a while.