Fig. 3.
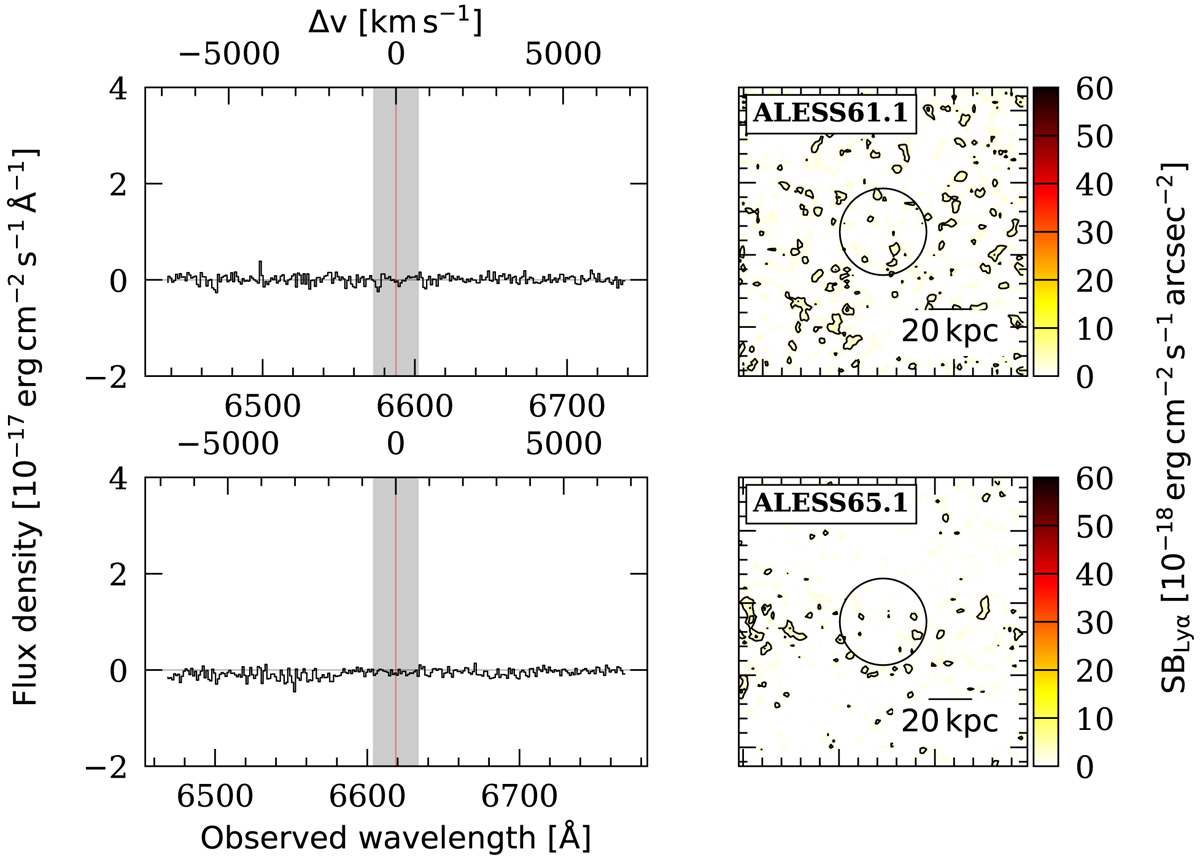
Download original image
Integrated spectra and SB maps of the two observed SMGs. Left: spectra integrated inside the 2″ radius aperture (black circle) of ALESS61.1 (top) and ALESS65.1 (bottom). The gray shaded area shows the channels used to build the SB map, and the vertical magenta line indicates the expected Lyα wavelength. Right: Lyα SB maps of the two SMGs at the expected wavelength from their redshift, listed in Table 1. The maps have a side of 20″, which at their redshifts corresponds to about 133 and 132 kpc for ALESS61.1 and ALESS65.1, respectively. A scale bar is shown for each map. These maps are smoothed using a 2D box kernel with a width of 3 pixels (0.6″). The black circles indicate an aperture of radius 2″ centered at the SMG position.
Current usage metrics show cumulative count of Article Views (full-text article views including HTML views, PDF and ePub downloads, according to the available data) and Abstracts Views on Vision4Press platform.
Data correspond to usage on the plateform after 2015. The current usage metrics is available 48-96 hours after online publication and is updated daily on week days.
Initial download of the metrics may take a while.