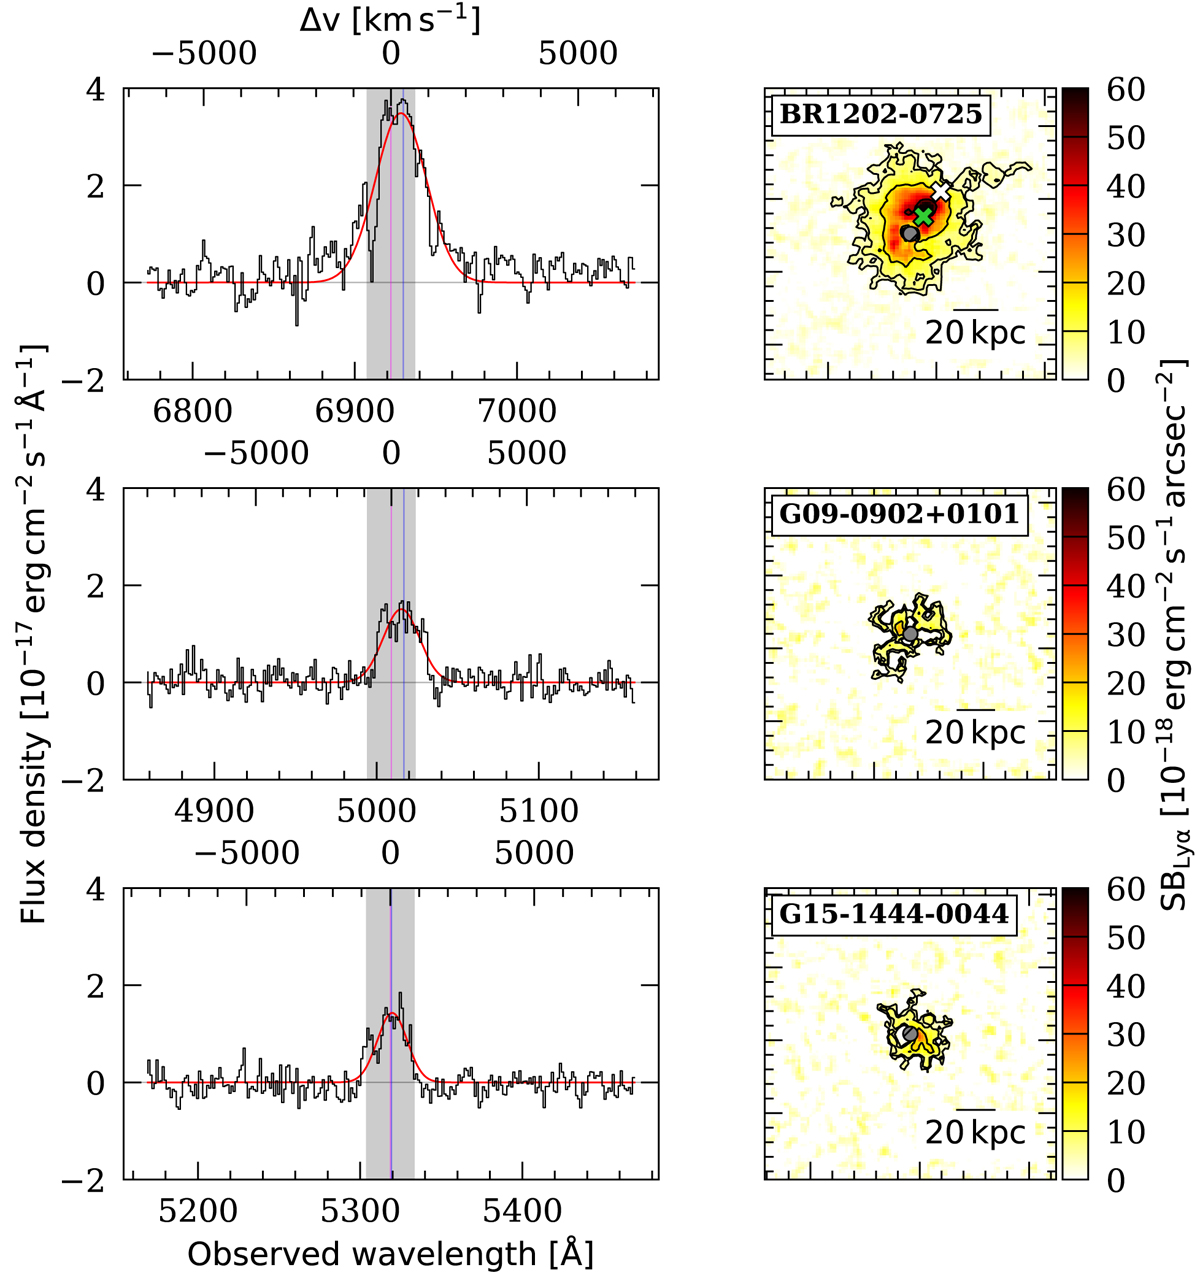
Fig. 2.
Download original image
Integrated spectra and SB maps of the extended Lyα emission around the three systems with AGNs. Left: spectra of the identified Lyα nebulae (black curve), integrated inside the 2σ contour. The gray shaded area shows the channels used to build the SB map. The vertical magenta line indicates the Lyα wavelength from the systemic redshift of the QSOs, while the vertical blue line indicates the wavelength at the peak of the Lyα spectra computed from the first moment of the line. Overlaid in red is a Gaussian fit to the spectra. The velocity shift and FWHM of each system are listed in Table 3. The top axis of the spectra panels show the velocity shift with respect to the systemic redshift in km s−1. Right: Lyα SB maps of BR1202 − 0725 (top), G09 − 0902 + 0101 (middle), and G15 − 1444 − 0044 (bottom) at the expected wavelength from their systemic redshift (Table 1). The maps have a side of 20″, corresponding to about 129, 152, and 148 kpc for BR1202 − 0725, G09 − 0902 + 0101, and G15 − 1444 − 0044, respectively. A scale bar of 20 kpc is indicated on each map. The black contours indicate SB levels of [2, 4, 10, 20, 50] σ (see Table 1). These maps are smoothed using a 2D box kernel with a width of 3 pixels (0.6″). The central 1″ × 1″ region used for the QSO PSF normalization is masked and excluded from analysis. For BR1202 − 0725, we indicate the position of the LAE and SMG companions (Carilli et al. 2013; Drake et al. 2020) with a green and white cross, respectively.
Current usage metrics show cumulative count of Article Views (full-text article views including HTML views, PDF and ePub downloads, according to the available data) and Abstracts Views on Vision4Press platform.
Data correspond to usage on the plateform after 2015. The current usage metrics is available 48-96 hours after online publication and is updated daily on week days.
Initial download of the metrics may take a while.