Fig. D.1.
Download original image
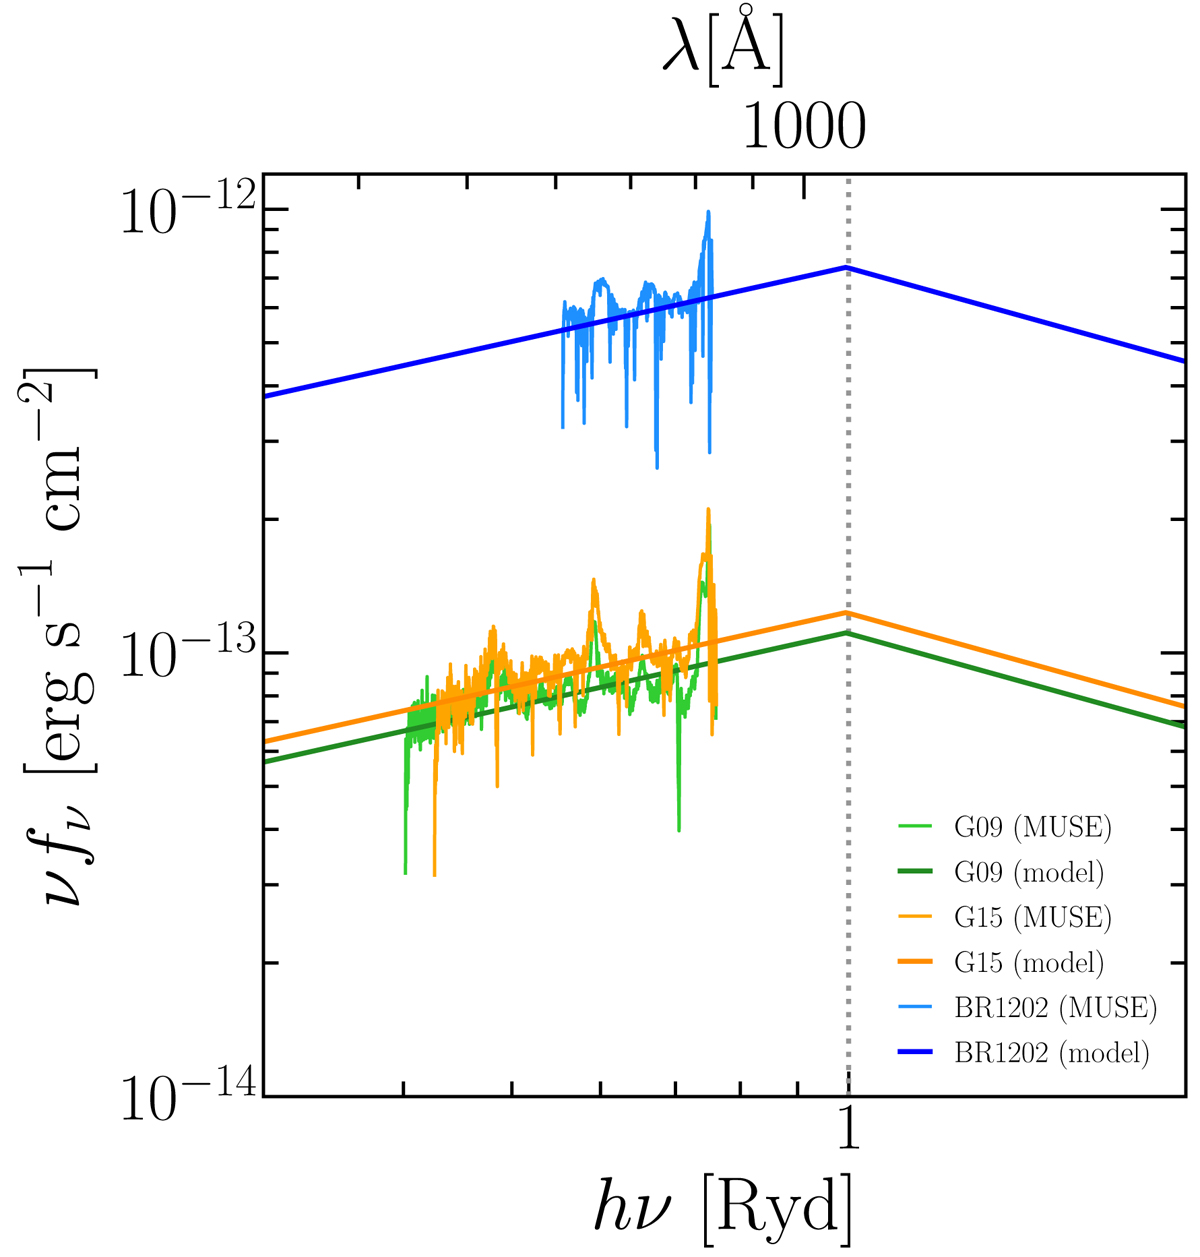
Comparison of the SED of the three QSOs studied here used as incident radiation field in the modeling. The blue, orange, and green lines indicate the input spectrum with slope αUV = −1.7 (Lusso et al. 2015) for BR1202-0725, G09-0902+0101, and G15-1444-0044, respectively. The curves of the same color indicate the MUSE spectrum of each QSO extracted within a 1.5″ radius aperture.
Current usage metrics show cumulative count of Article Views (full-text article views including HTML views, PDF and ePub downloads, according to the available data) and Abstracts Views on Vision4Press platform.
Data correspond to usage on the plateform after 2015. The current usage metrics is available 48-96 hours after online publication and is updated daily on week days.
Initial download of the metrics may take a while.