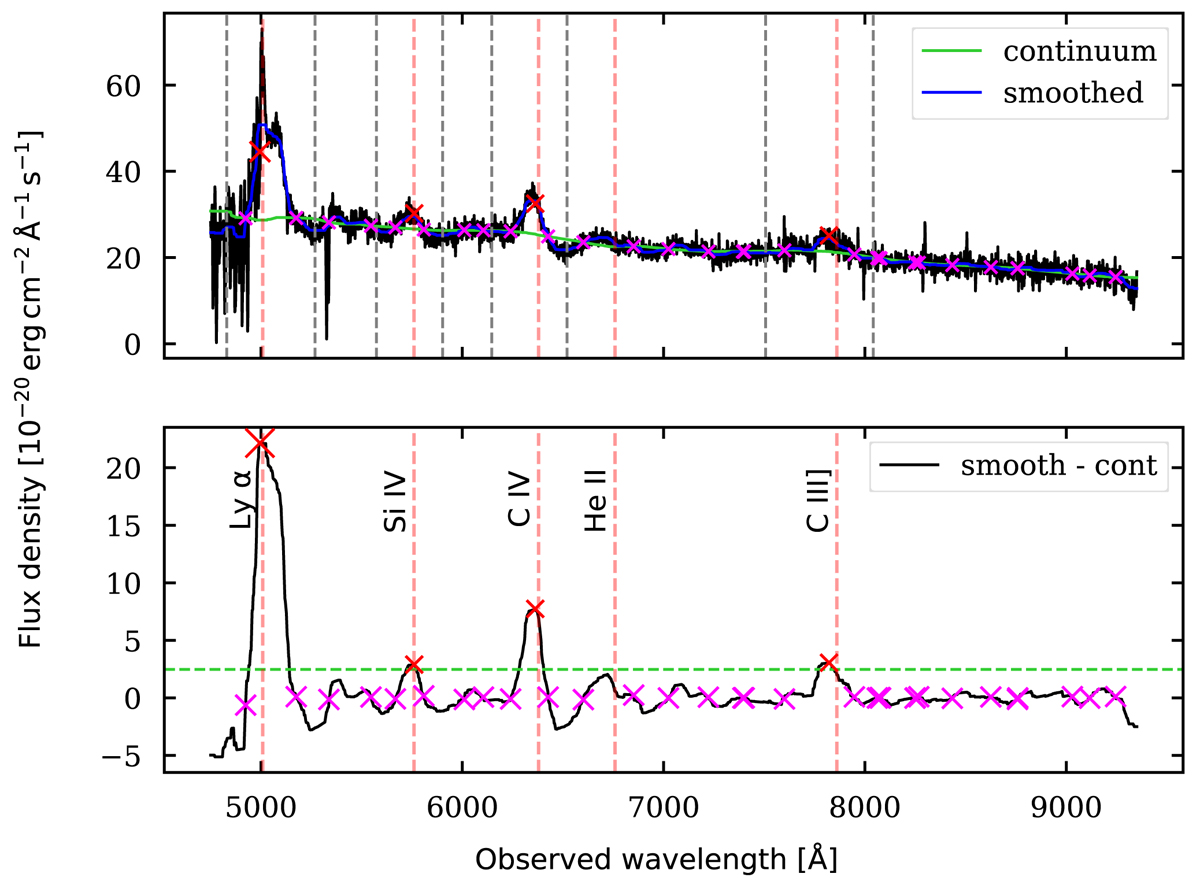
Fig. B.1.
Download original image
Example of a QSO broad-line emission identification, for G09-0902+0101. Top: Integrated spectrum inside a 1 arcsecond diameter aperture of G09-0902+0101, shown in black. Overlaid are a smoothed spectrum (blue) and a continuum spectrum (green), constructed using a median filter of 50 and 500 channels, respectively. The red and pink crosses indicate detected peaks of line emission and the intersection between the smooth and continuum spectra, respectively. The vertical gray lines indicate the regions where each line emission is excluded to build the PSF (see Sect. 3.1). Bottom: Difference spectrum between the smooth and continuum spectrum of the top panel. The dashed green line indicates the 3σ threshold for line identification. We indicate with a dashed red line the position of the QSO’s Lyα and broad-line emissions, with their respective labels.
Current usage metrics show cumulative count of Article Views (full-text article views including HTML views, PDF and ePub downloads, according to the available data) and Abstracts Views on Vision4Press platform.
Data correspond to usage on the plateform after 2015. The current usage metrics is available 48-96 hours after online publication and is updated daily on week days.
Initial download of the metrics may take a while.