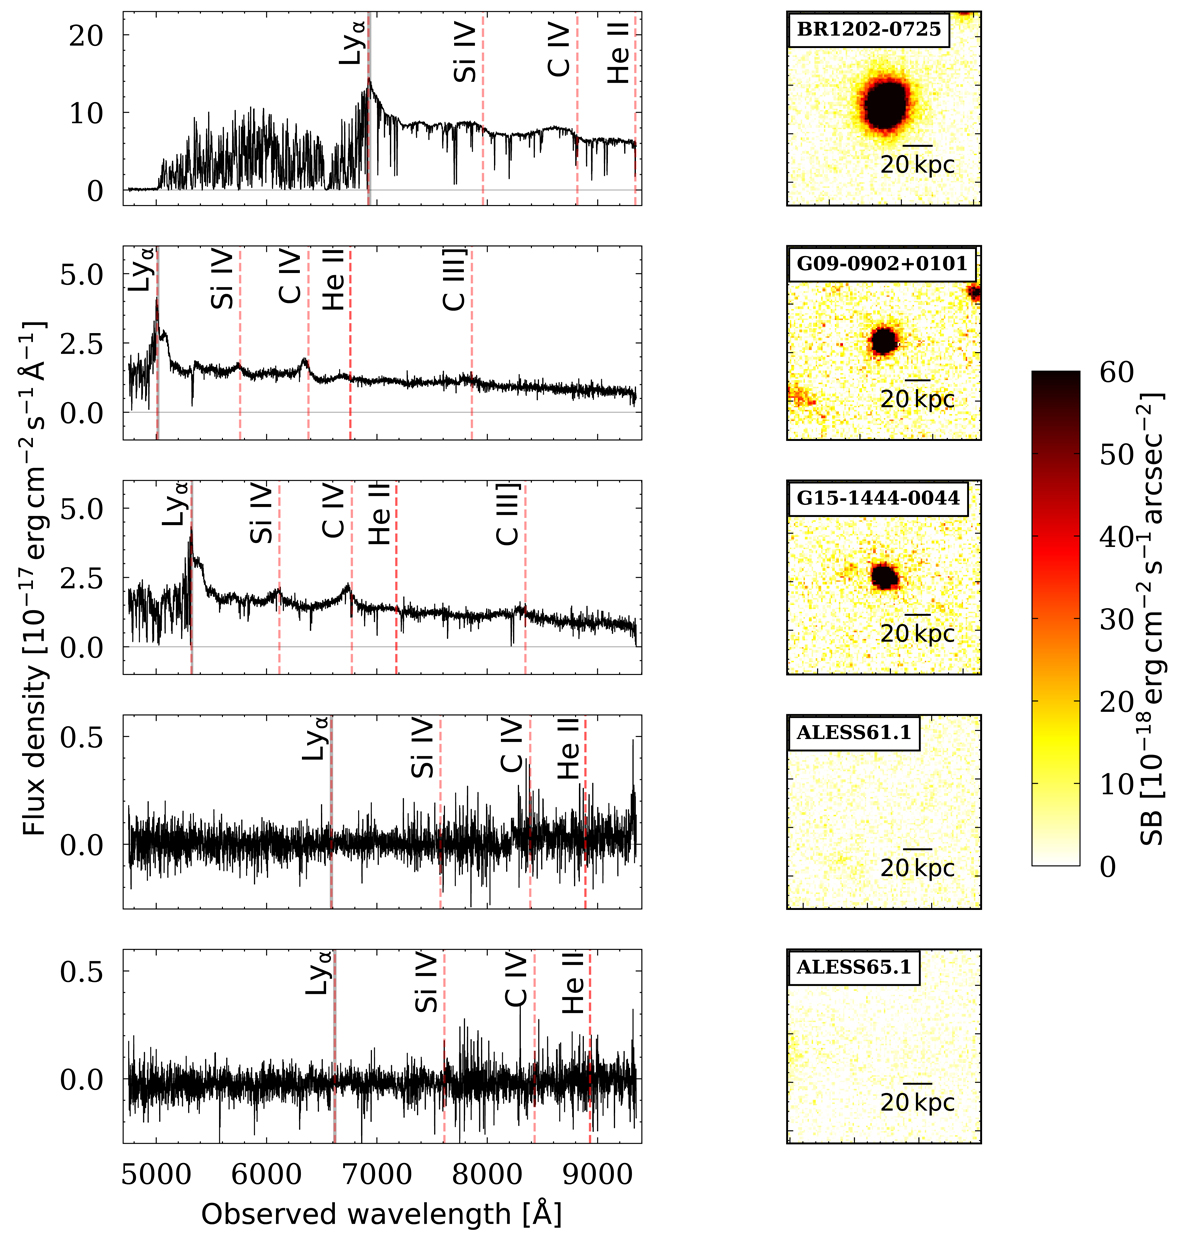
Fig. 1.
Download original image
Overview of the five targeted systems before subtraction of the unresolved QSO’s PSF and continuum sources (see Sect. 3). Left: integrated spectra of the QSOs and SMGs inside a 3″ radius aperture. Vertical dashed lines indicate the positions of the Lyα and QSO broad lines (Si IV, C IV, HeII, and CIII[[INLINE106]]). The gray shaded region indicates the FWHM of the nebular Lyα emission for the QSOs (see Fig. 2 and Table 3) and the 30 Å narrow band used for the SMGs (see Fig. 3). Right: 30 Å SB maps at the expected Lyα wavelength of the targeted QSOs and SMGs before PSF- and continuum-subtraction (see Sect. 3). The maps have a side of 20″, corresponding to about 129, 152, 148, 133, and 132 kpc for BR1202 − 0725, G09 − 0902 + 0101, G15 − 1444 − 0044, ALESS61.1, and ALESS65.1, respectively.
Current usage metrics show cumulative count of Article Views (full-text article views including HTML views, PDF and ePub downloads, according to the available data) and Abstracts Views on Vision4Press platform.
Data correspond to usage on the plateform after 2015. The current usage metrics is available 48-96 hours after online publication and is updated daily on week days.
Initial download of the metrics may take a while.