Open Access
Fig. 4
Download original image
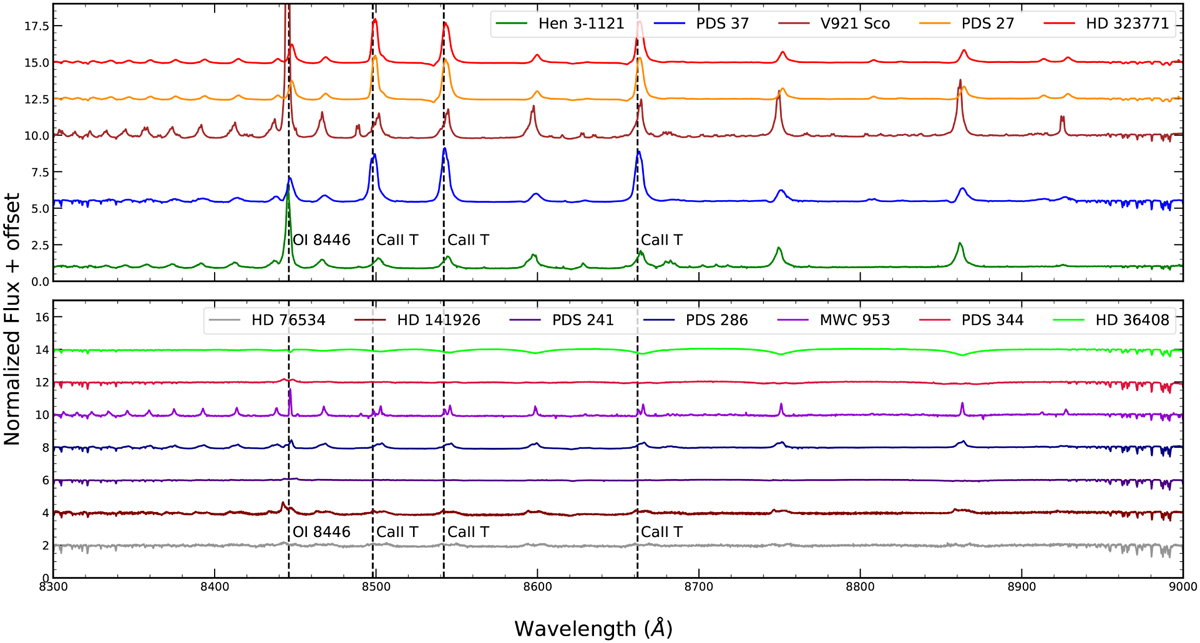
X-shooter spectra showing the differences in Paschen and CaII triplet profiles belonging to intense (top panel) and weak (bottom panel) HBe stars. The OI 8446 Å and CaII triplet lines are marked with dashed lines. The difference in intensity of the emission lines can be seen between the top and bottom panels.
Current usage metrics show cumulative count of Article Views (full-text article views including HTML views, PDF and ePub downloads, according to the available data) and Abstracts Views on Vision4Press platform.
Data correspond to usage on the plateform after 2015. The current usage metrics is available 48-96 hours after online publication and is updated daily on week days.
Initial download of the metrics may take a while.