Fig. 2
Download original image
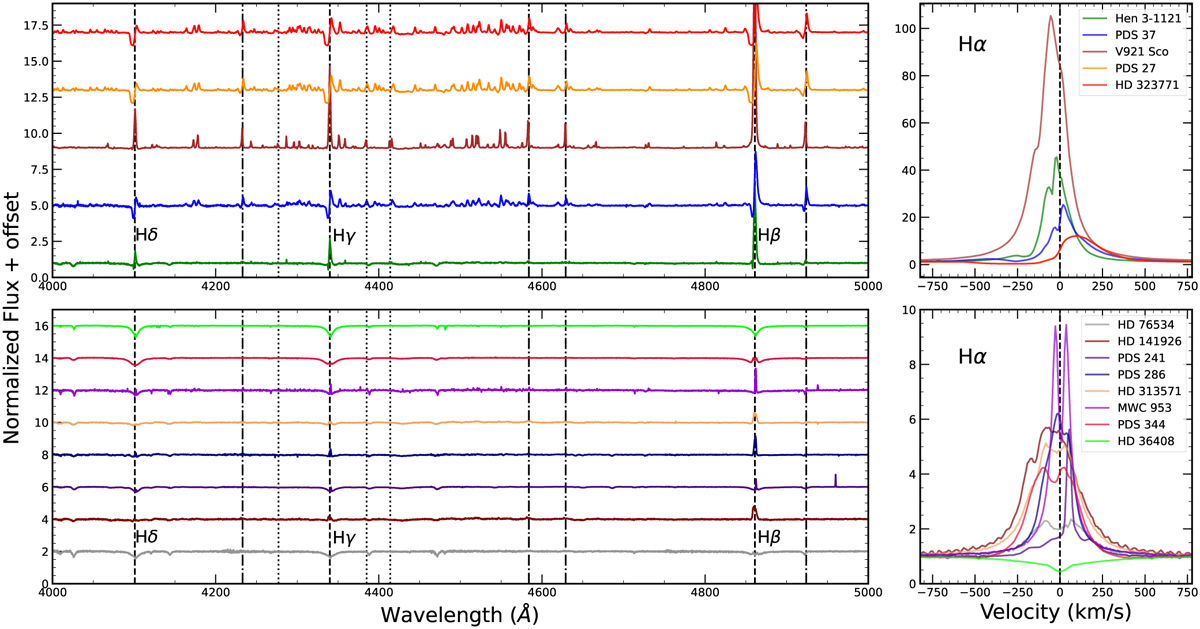
X-shooter spectra showing the differences in Balmer profiles belonging to intense (top panel) and weak (bottom panel) HBe stars. The top left panel shows the higher order Balmer lines, selected FeII (dash-dotted), and [FeII] (dotted) lines present in the spectra of intense HBe stars. The top right panel shows the Hα profiles of intense HBe stars, where the blueshifted absorptions are clearly seen. The bottom panels show the spectra of weak HBes, where the emission lines are feeble compared to intense HBes. The spectra displayed in this work were not corrected for Doppler shift due to the stellar radial velocity.
Current usage metrics show cumulative count of Article Views (full-text article views including HTML views, PDF and ePub downloads, according to the available data) and Abstracts Views on Vision4Press platform.
Data correspond to usage on the plateform after 2015. The current usage metrics is available 48-96 hours after online publication and is updated daily on week days.
Initial download of the metrics may take a while.