Fig. 1
Download original image
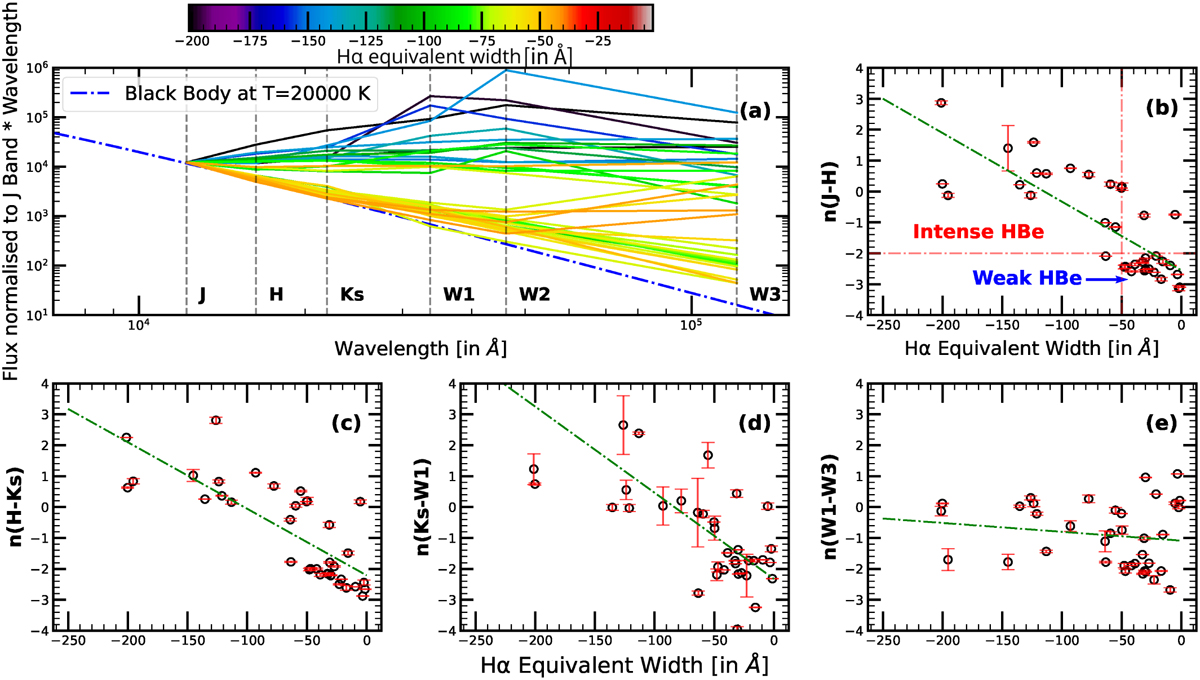
Panel a visualises the NIR excess present in the SED of early HBe stars studied in this work. The colour of each SED represents the Hα emission strength. The dash-dotted line represents the blackbody SED for T = 20 000 K. The flux values were normalised to the J band for visual purposes. The mean wavelength of each IR filter is marked using dashed lines. Panels b–e represent the distribution of Lada indices between IR magnitudes with respect to the Hα EW. The green dash-dotted lines in panels b–e show a linear fit to the scatter points shown in each plot. The red dash-dotted lines in panel b represent the cutoffs (|Hα EW| = 50 Å and n(J–H) = −2) used to separate the intense and weak HBe stars.
Current usage metrics show cumulative count of Article Views (full-text article views including HTML views, PDF and ePub downloads, according to the available data) and Abstracts Views on Vision4Press platform.
Data correspond to usage on the plateform after 2015. The current usage metrics is available 48-96 hours after online publication and is updated daily on week days.
Initial download of the metrics may take a while.