Fig. 8
Download original image
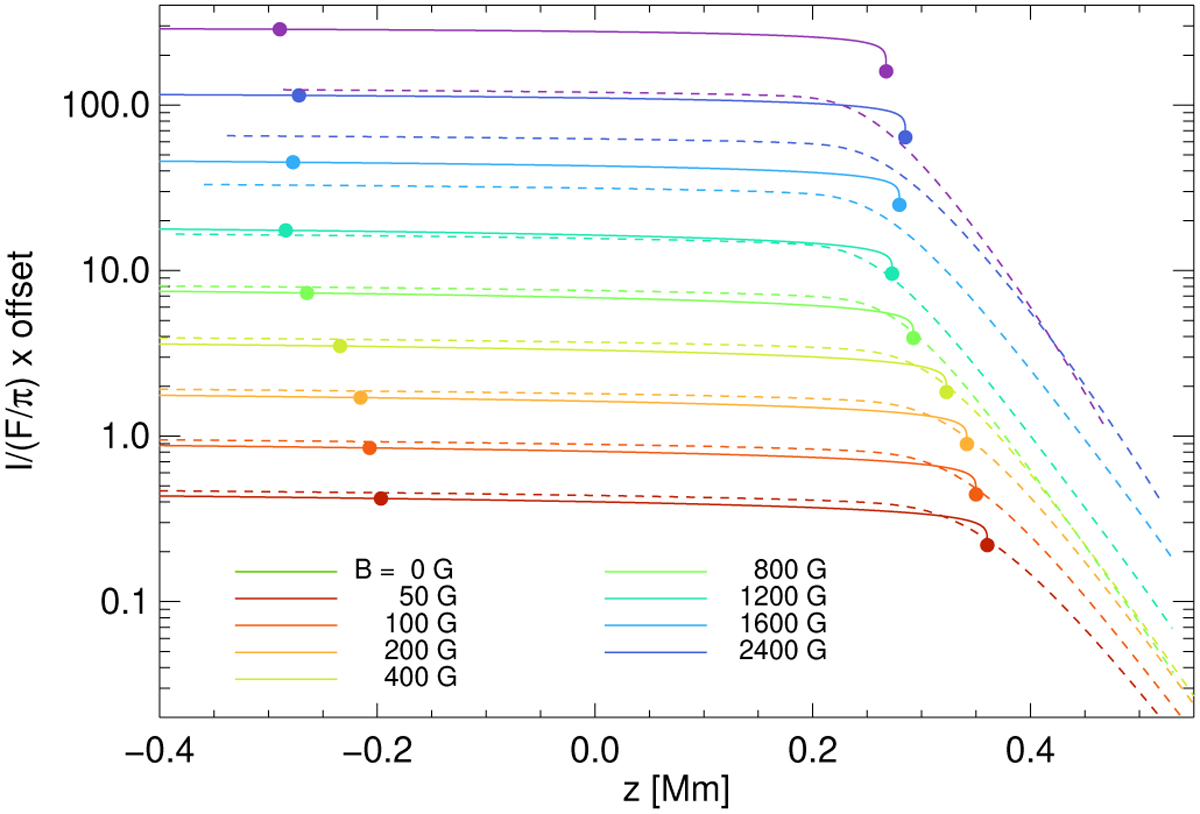
Intensity proflies at the extreme stellar limb of the nine MHD models. The solid lines are the fitted intensity profiles using the Claret-4 law. The dashed lines depict the result of radiative transfer calculations along tangential rays in the gray approximation. The dots to the right mark the position μ = 0 (the location of the stellar radius), and the dots to the left μ = 0.04. The solid lines end at dots marking μ = 0 as the stellar limb and limit of definition of the Claret–4 law. For clarity, the curves were scaled in steps of factors of two in the vertical direction, with model В = 0 G at its original position. In this plot, the zero points of the z-scales are located at a radial Rosseland optical depth of one in the respective model.
Current usage metrics show cumulative count of Article Views (full-text article views including HTML views, PDF and ePub downloads, according to the available data) and Abstracts Views on Vision4Press platform.
Data correspond to usage on the plateform after 2015. The current usage metrics is available 48-96 hours after online publication and is updated daily on week days.
Initial download of the metrics may take a while.