Fig. E.2
Download original image
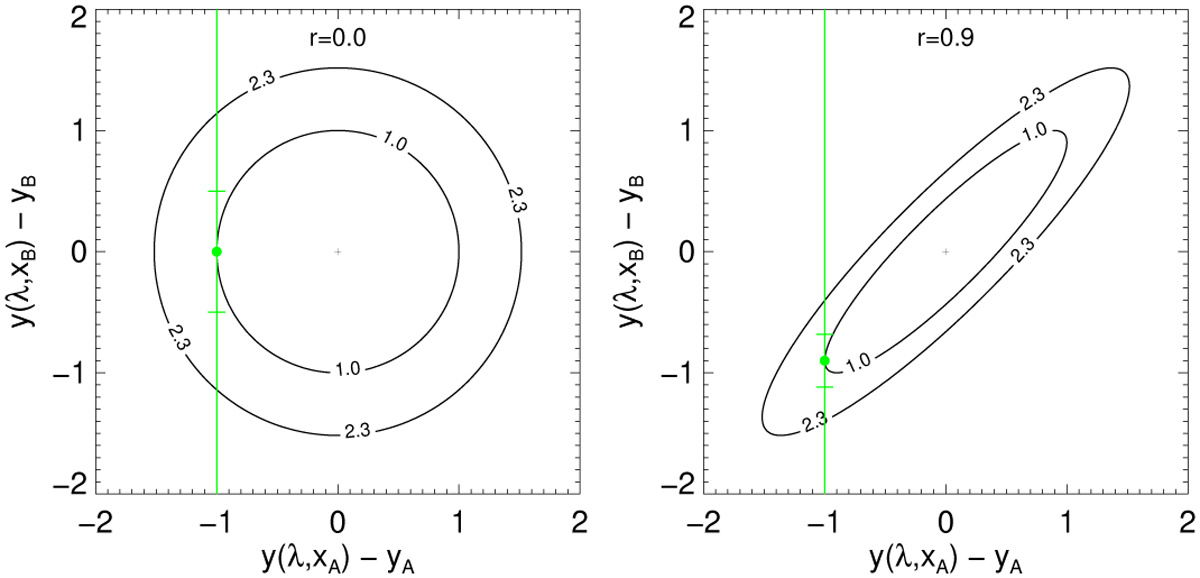
Maps of χ2 according Eq. (E.5). Two examples for a different degree of correlation, r, are shown. In both cases σ2 = 1 is assumed. Contour lines illustrate the situation for arbitrary deviations from (yA, yB), the green line the one-dimensional subset selected by the fitting function (E.2). The green dot marks the best fitting λ. Short streaks indicate the uncertainty.
Current usage metrics show cumulative count of Article Views (full-text article views including HTML views, PDF and ePub downloads, according to the available data) and Abstracts Views on Vision4Press platform.
Data correspond to usage on the plateform after 2015. The current usage metrics is available 48-96 hours after online publication and is updated daily on week days.
Initial download of the metrics may take a while.