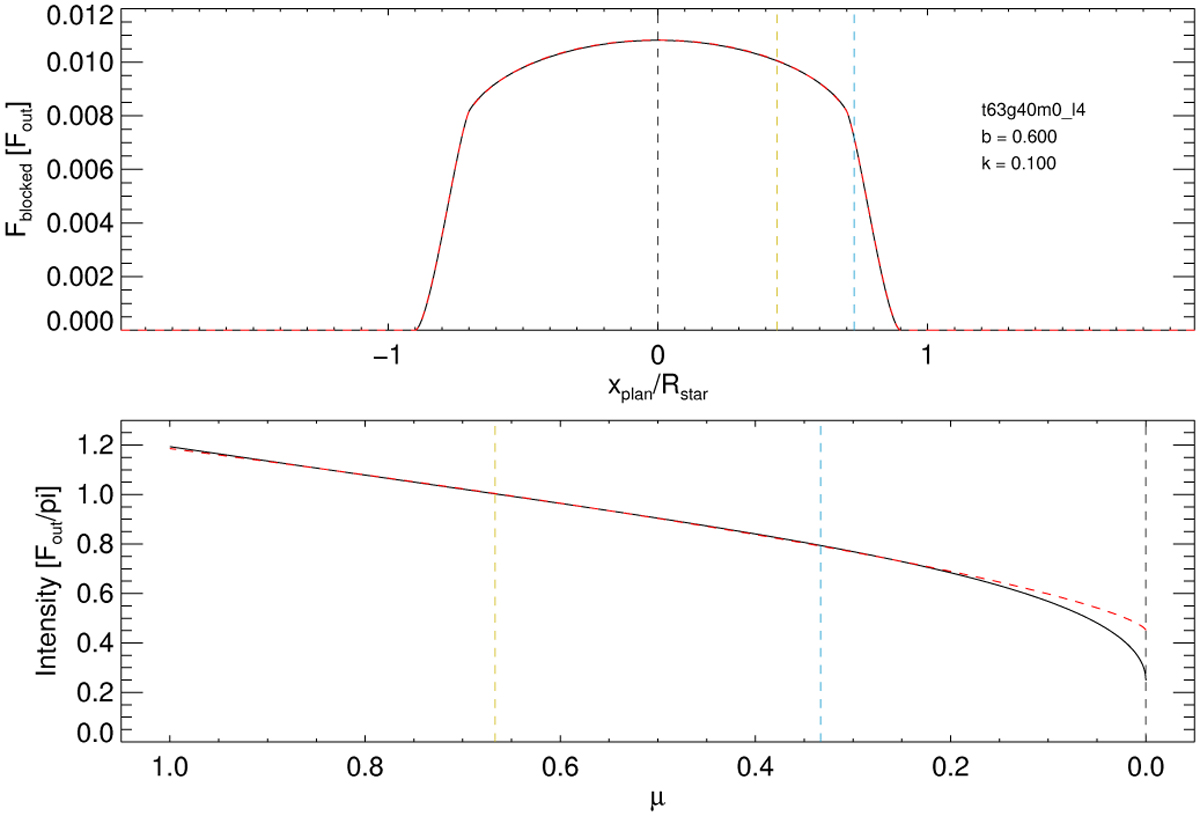
Fig. C.2

Download original image
Typical example of the outcome of the light curve fitting for a non-magnetic model. Upper panel: a comparison between the input light curve based on the Claret-4 law (solid black line), and the fit with a power-2 law (dashed red line). The curves are shown in terms of the light blocked by the planet as a function of its geometrical position, xpian, in units of the stellar radius. Both curves are hardly distinguishable on the scale of the plot. At the given geometry a maximum of μ = 0.8 is reached during transit. Lower panel: input (solid black line) and fitted (dashed red line) LD laws. In both panels, the dashed blue and yellow lines mark locations corresponding to μ = 1/3 and 2/3. For further details, see the text.
Current usage metrics show cumulative count of Article Views (full-text article views including HTML views, PDF and ePub downloads, according to the available data) and Abstracts Views on Vision4Press platform.
Data correspond to usage on the plateform after 2015. The current usage metrics is available 48-96 hours after online publication and is updated daily on week days.
Initial download of the metrics may take a while.


