Fig. 13
Download original image
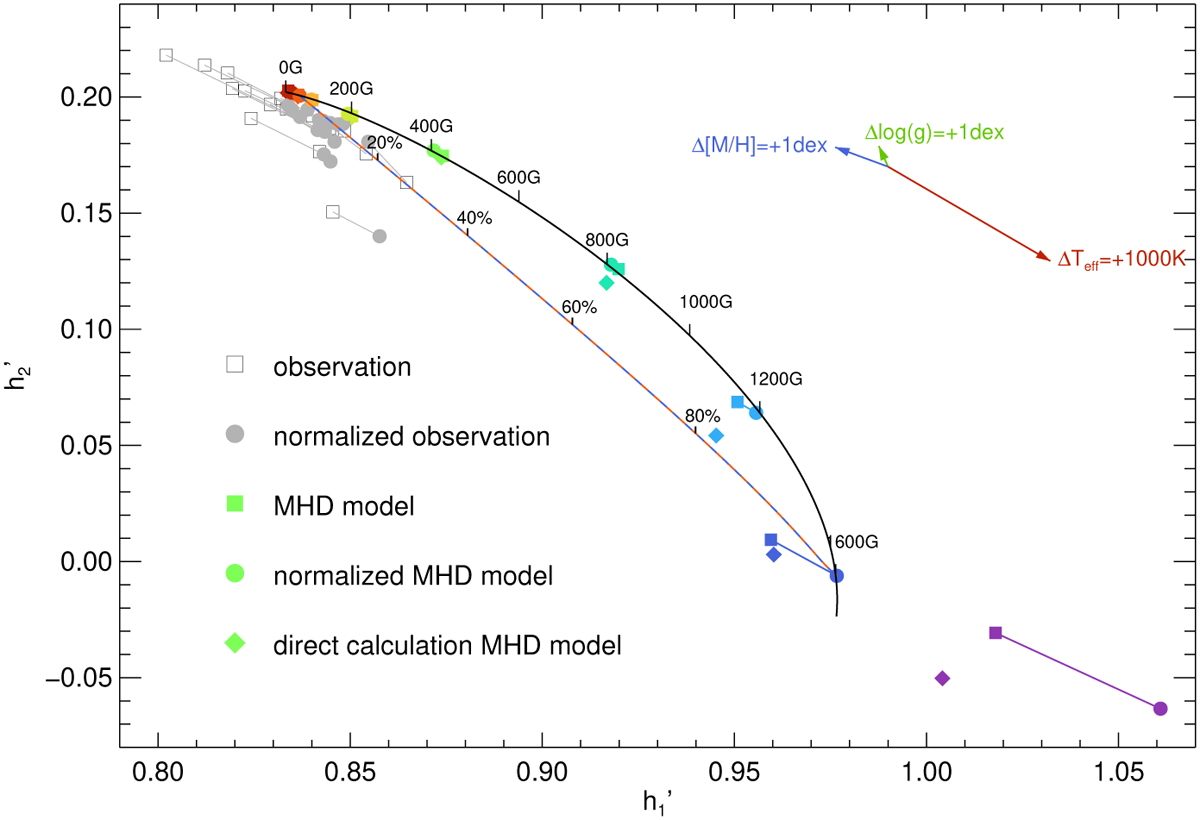
Comparison between observations of M18 and calculations in the h′1-h′2-plane. Symbols in color depict the results from solar MHD simulations. Gray and black symbols show the observational data. Data points before and after normalization are connected by a line. The solid black line labeled with field strengths is a fit to the MHD models to guide the eye. The dash-dotted line illustrates the outcome of an additive mixing of models B0050 and B1600, where percentages give the area fraction contributed by B1600. See the text for more explanations on the approach. The colored arrows indicate the sensitivity of the (h′1, h′2)-vector to the atmospheric parameters.
Current usage metrics show cumulative count of Article Views (full-text article views including HTML views, PDF and ePub downloads, according to the available data) and Abstracts Views on Vision4Press platform.
Data correspond to usage on the plateform after 2015. The current usage metrics is available 48-96 hours after online publication and is updated daily on week days.
Initial download of the metrics may take a while.