Fig. 9
Download original image
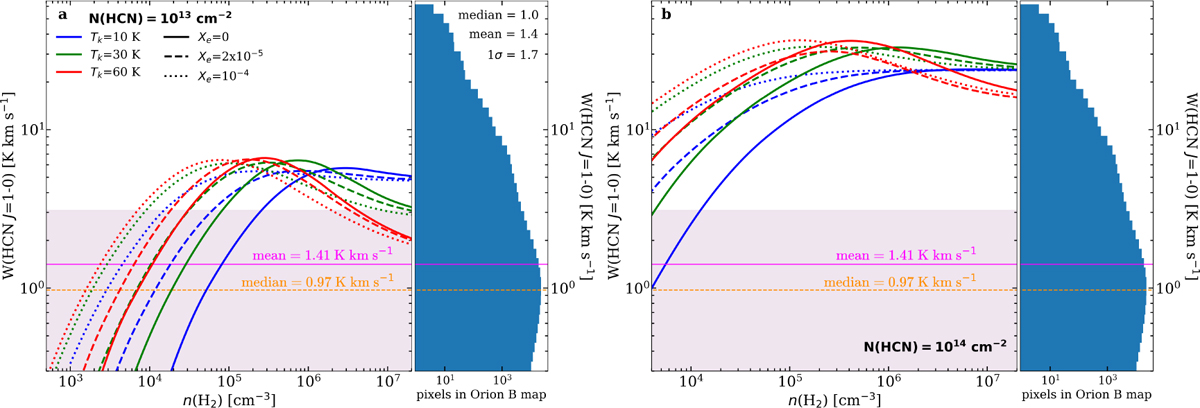
Comparison of observed W(HCN J = 1−0) intensities in Orion B and predictions from nonlocal and non-LTE radiative transfer models including line overlap for (a) N(HCN) = 1013 cm−2 and (b) N(HCN) = 1014 cm−2. The continuous curves show model results for Tk = 60, 30, and 10 K (red, green, and blue curves, respectively), different ionization fractions: χe = 0 (continuous curves), χe = 2×10⁻⁵ (dashed curves), and χe = 10−4 (dotted curves). The pink and orange horizontal line mark the mean and median values of W(HCN J = 1−0). The pink shaded area represents the standard deviation (1er) relative to the mean detected W(HCN J = 1−0) intensities in Orion B (at 30″). Positions in the pink area account for -70% of the total LHCN 1−0 in the map. The right panels show an histogram with the distribution of W(HCN J =1−0) detections in individual map pixels.
Current usage metrics show cumulative count of Article Views (full-text article views including HTML views, PDF and ePub downloads, according to the available data) and Abstracts Views on Vision4Press platform.
Data correspond to usage on the plateform after 2015. The current usage metrics is available 48-96 hours after online publication and is updated daily on week days.
Initial download of the metrics may take a while.