Fig. 8
Download original image
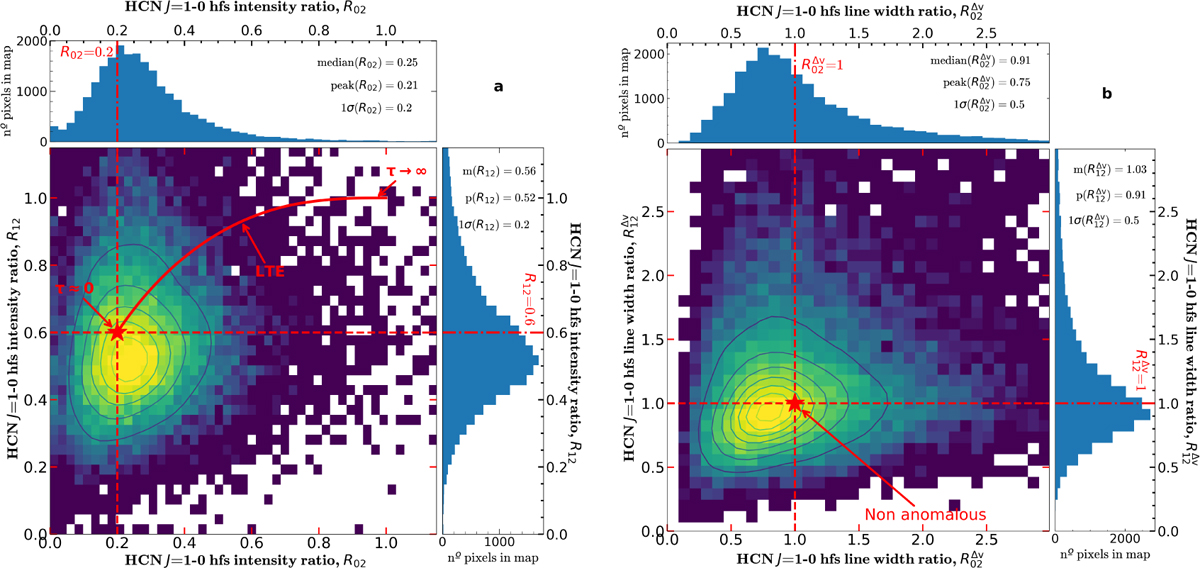
Histograms of HCN J =1−0 HFS (a) Line intensity ratios, and (b) Line-width ratios observed in OrionB. R02 stands for W(F = 0−1)/W(F = 2−1) and R12 stands for W(F = 1–1)/W(F = 2−1). The red curve in panel (a) shows the expected LTE ratios as line opacities increase. The red star marks the non-anomalous ratios in the optically thin limit τ → 0 (1σ is the standard deviation relative to the mean line ratios).
Current usage metrics show cumulative count of Article Views (full-text article views including HTML views, PDF and ePub downloads, according to the available data) and Abstracts Views on Vision4Press platform.
Data correspond to usage on the plateform after 2015. The current usage metrics is available 48-96 hours after online publication and is updated daily on week days.
Initial download of the metrics may take a while.