Open Access
Fig. 7
Download original image
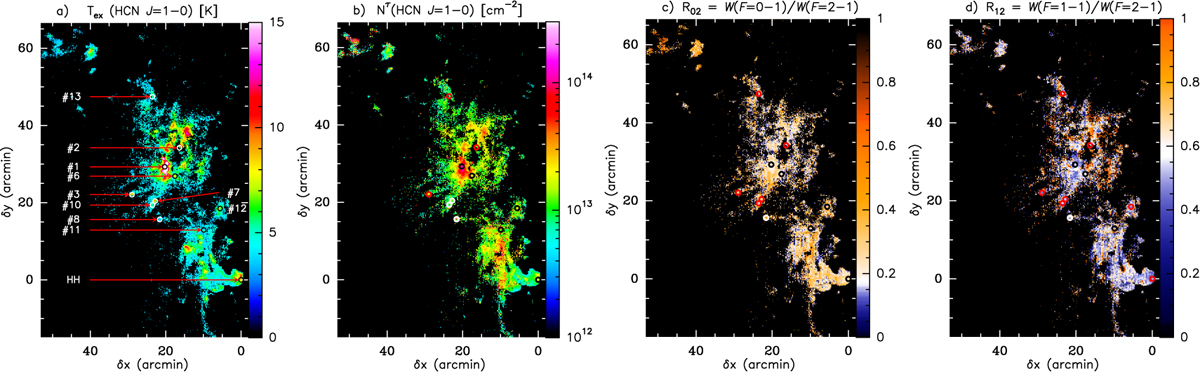
Spatial distribution of Tex(HCN J = 1−0) and N(HCN) estimated from LTE-HFS fits, and maps of HCN J = 1−0 HFS intensity ratios. (a) Tex(HCN J = 1−0). (b) Opacity-corrected column densities N(HCN). (c) and (d) R02 and R12 (white color corresponds to non-anomalous ratios).
Current usage metrics show cumulative count of Article Views (full-text article views including HTML views, PDF and ePub downloads, according to the available data) and Abstracts Views on Vision4Press platform.
Data correspond to usage on the plateform after 2015. The current usage metrics is available 48-96 hours after online publication and is updated daily on week days.
Initial download of the metrics may take a while.