Fig. 4
Download original image
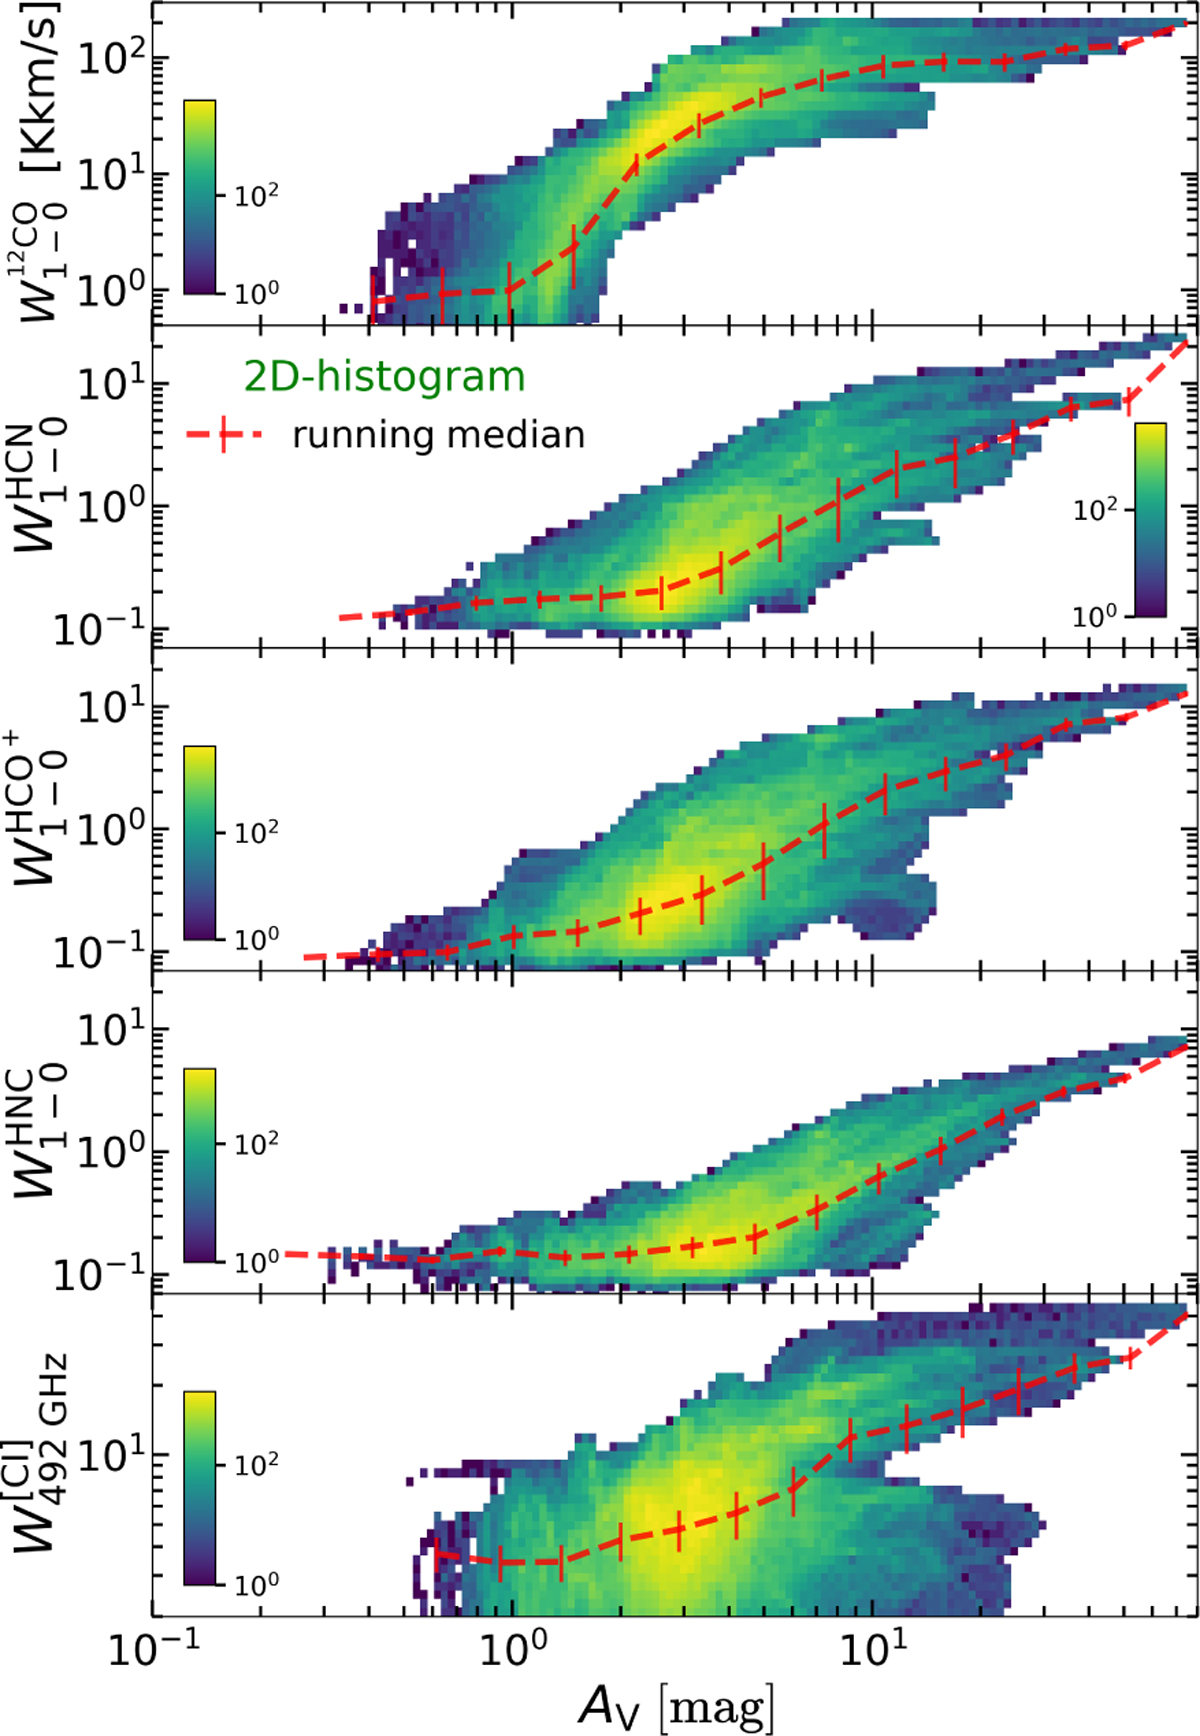
Distribution of 12CO, HCN, HCO+, HNC J = 1−0, and [C I] 492 GHz line intensities as a function of AV. The dashed red lines show the running median (median values of the line intensity within equally spaced log AV bins). Error bars show the line intensity dispersion. We note that the 5σ error of AV is ≃0.8 mag. Thus, one cannot trust any trend below this threshold.
Current usage metrics show cumulative count of Article Views (full-text article views including HTML views, PDF and ePub downloads, according to the available data) and Abstracts Views on Vision4Press platform.
Data correspond to usage on the plateform after 2015. The current usage metrics is available 48-96 hours after online publication and is updated daily on week days.
Initial download of the metrics may take a while.