Fig. D.1
Download original image
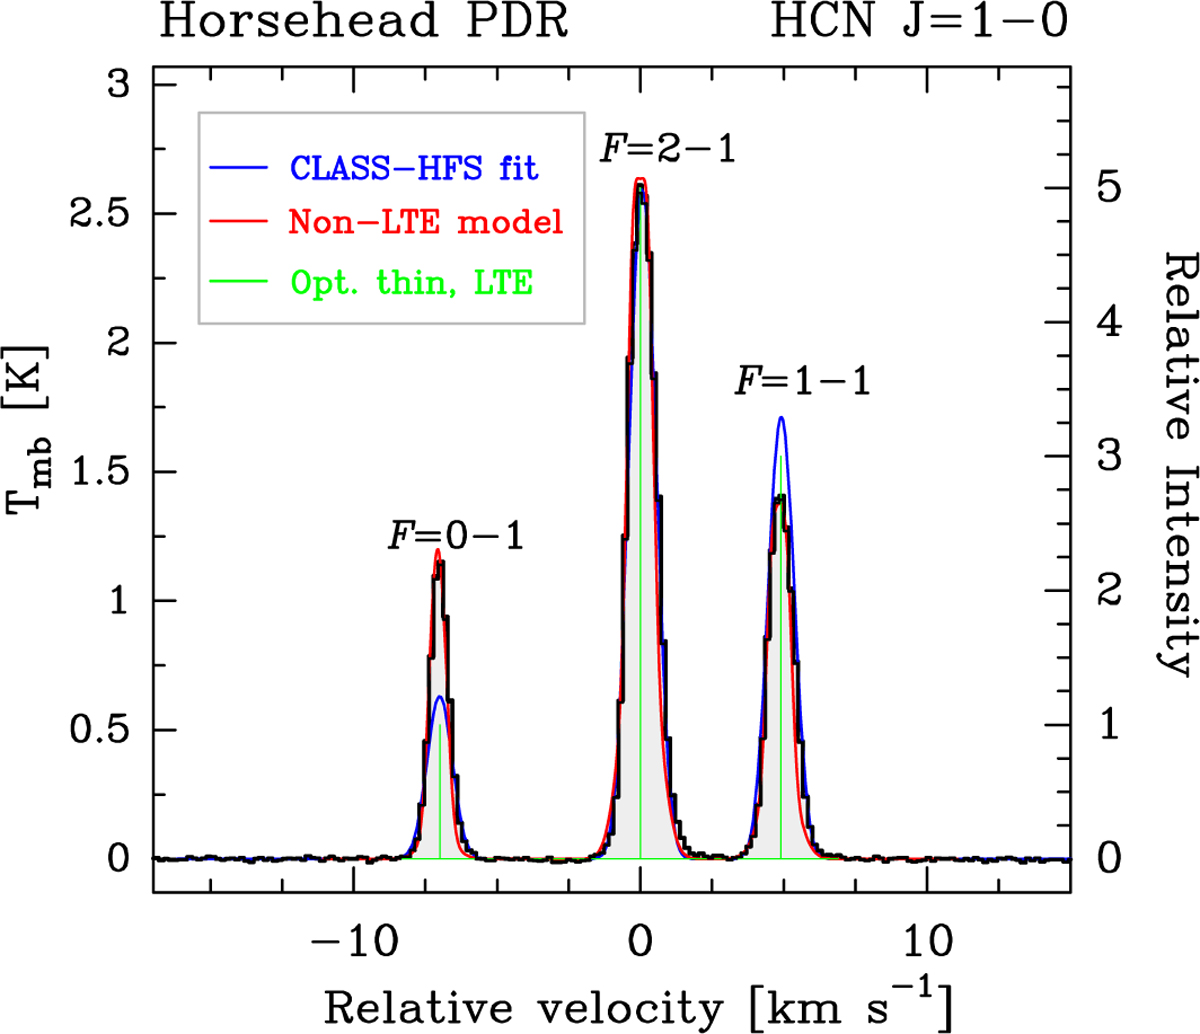
HCN J =1−0 HFS lines toward the Horsehead PDR. The right axis shows the normalized line intensity to make clear that the observed HFS emission differs from the optically thin LTE line ratios 1:5:3 (green lines). Red curves show the results of a non-LTE radiative transfer model including line overlaps (for details, see Sect. 5.1 in Goicoechea et al. 2022). Blue curves show the best LTE-HFS fit using CLASSfootnote 2.
Current usage metrics show cumulative count of Article Views (full-text article views including HTML views, PDF and ePub downloads, according to the available data) and Abstracts Views on Vision4Press platform.
Data correspond to usage on the plateform after 2015. The current usage metrics is available 48-96 hours after online publication and is updated daily on week days.
Initial download of the metrics may take a while.