Open Access
Fig. B.1
Download original image
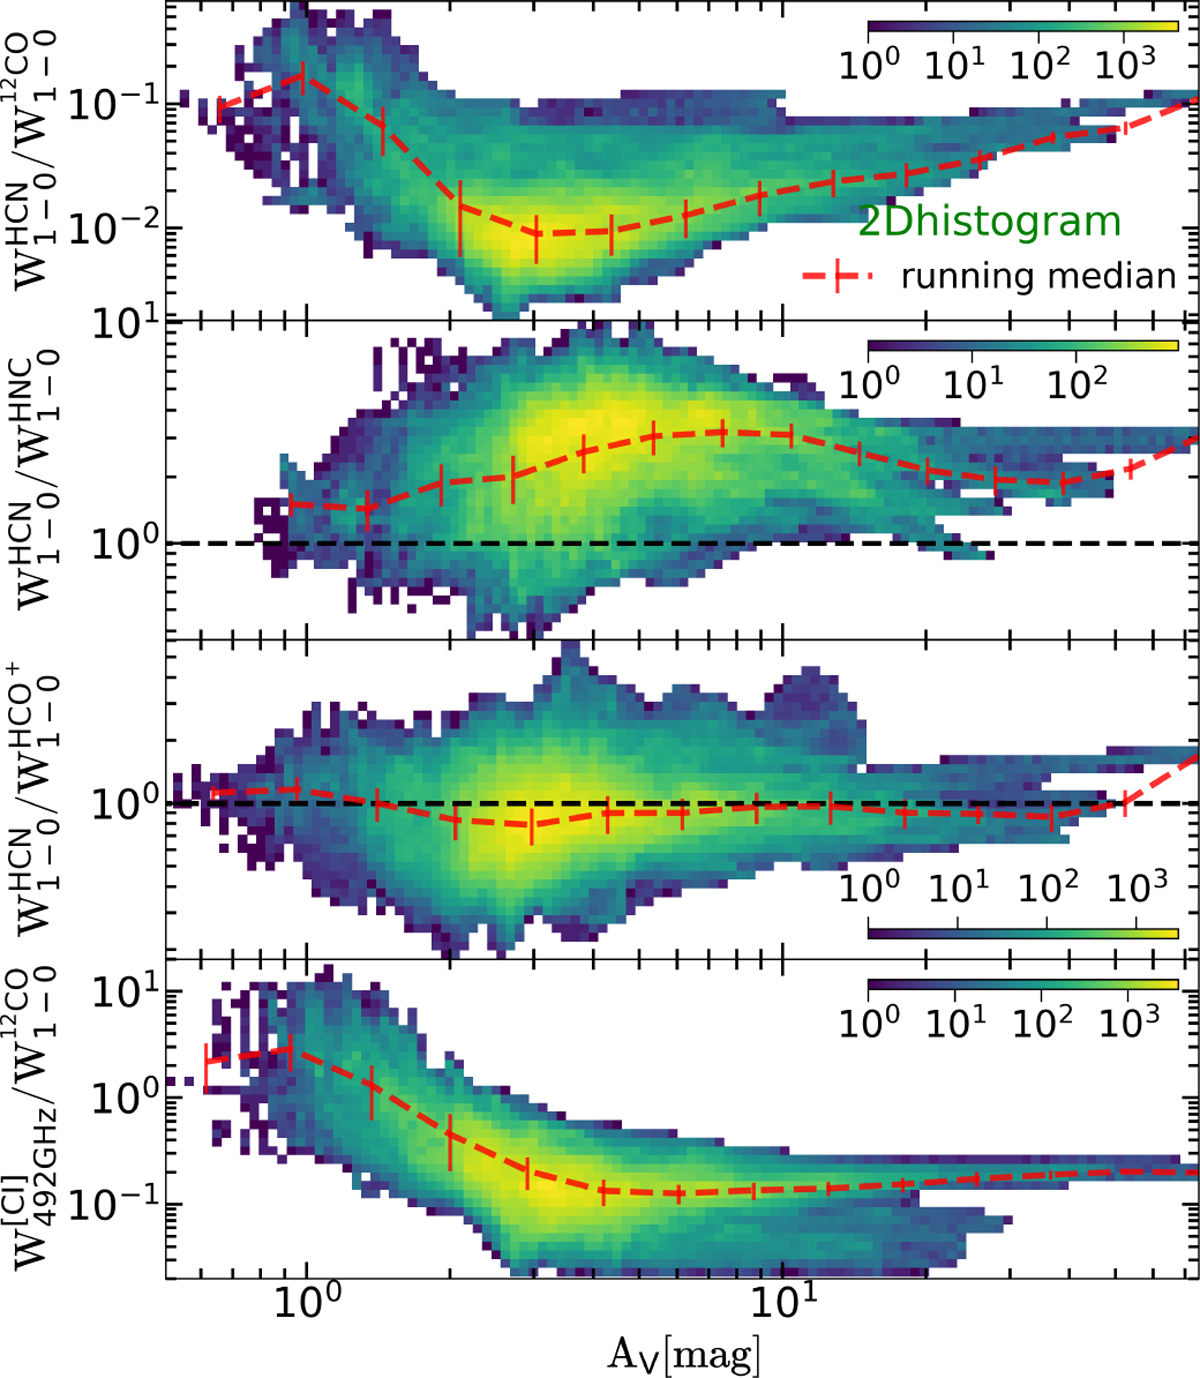
2D histograms showing the line intensity ratios HCN/CO, HCN/HNC, HCN/HCO+ J = 1–0, and [C I] 492 GHz/CO J = 1–0 with respect to the visual extinction AV. The dashed red line marks the running median. The error bars mark the standard deviation. The dashed black line marks the intensity ratio equal to one.
Current usage metrics show cumulative count of Article Views (full-text article views including HTML views, PDF and ePub downloads, according to the available data) and Abstracts Views on Vision4Press platform.
Data correspond to usage on the plateform after 2015. The current usage metrics is available 48-96 hours after online publication and is updated daily on week days.
Initial download of the metrics may take a while.