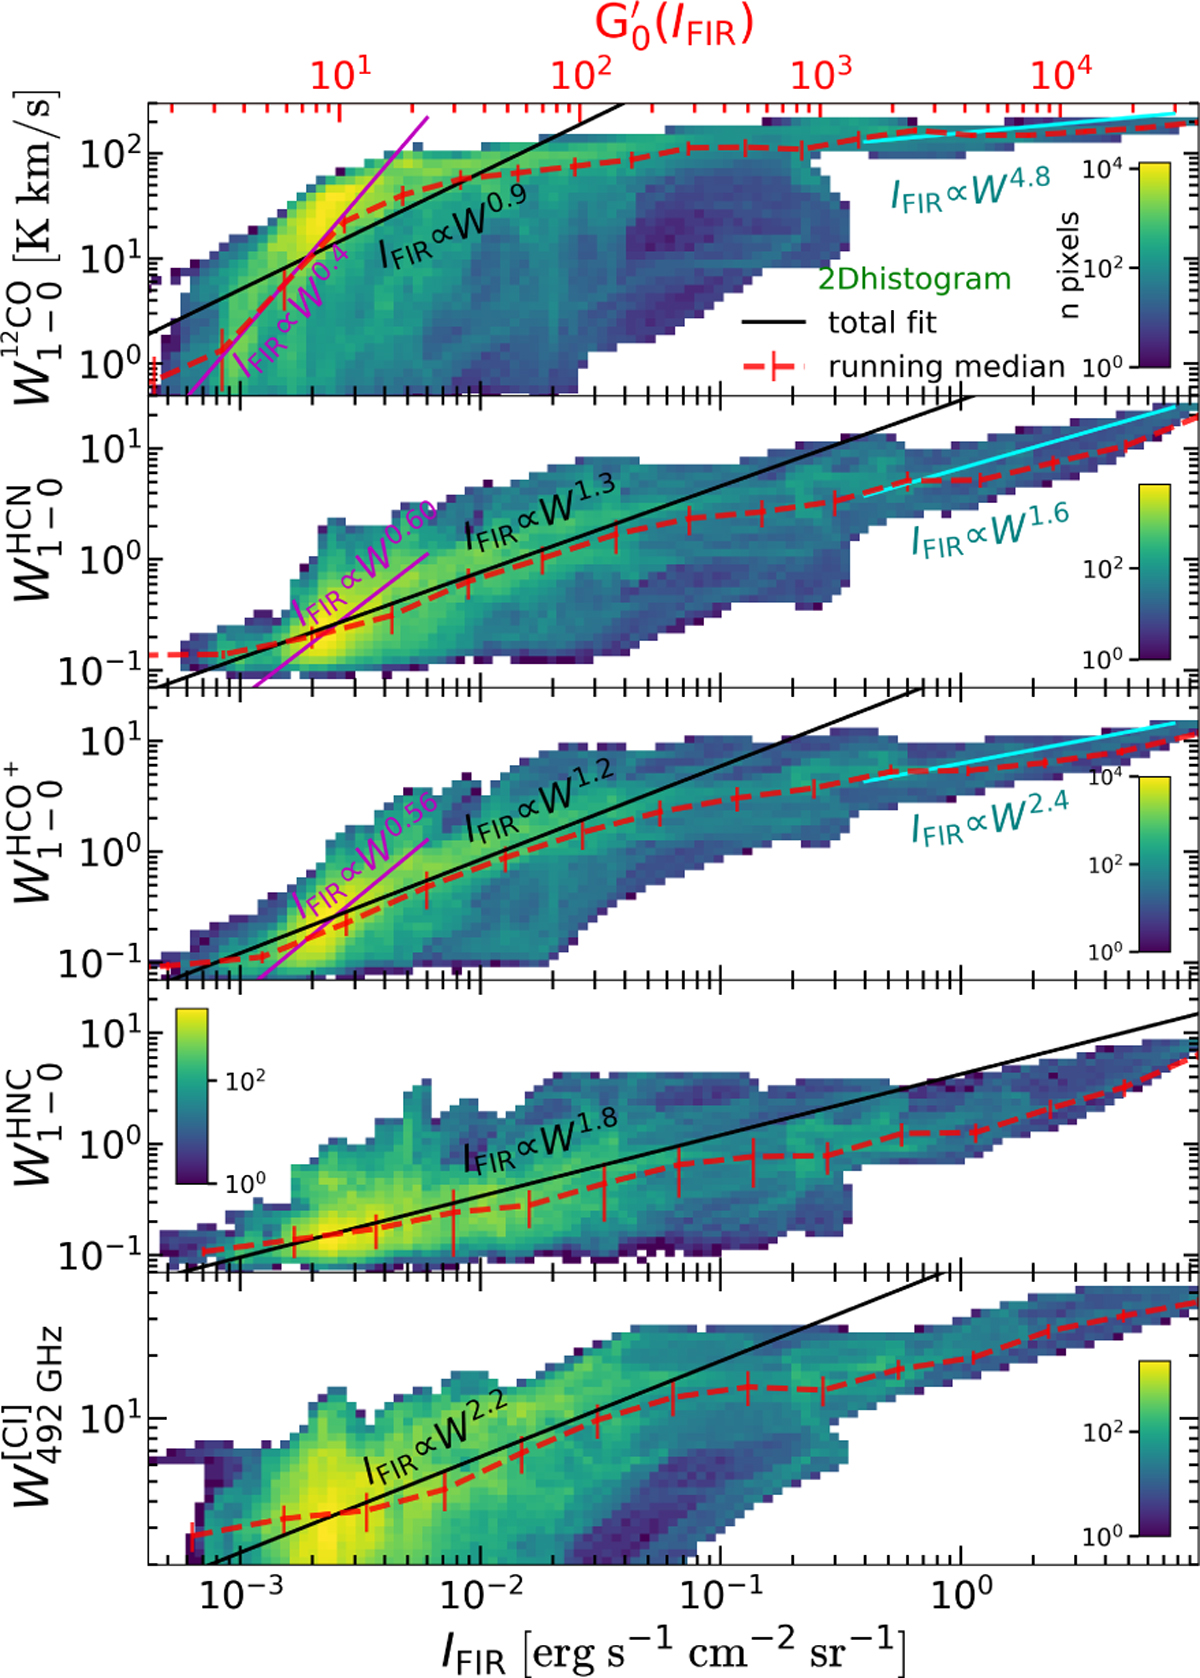
Fig. 18
Download original image
2D histograms of the 12CO, HCN, HCO+, HNC, J = 1–0, and [C I]3P1 – 3P0 line intensities as a function of FIR intensity in Orion B (from maps at 120″ resolution). The dashed red lines show the running median (median values of the integrated intensity within equally spaced log IFIR bins). The error bars show their dispersion. Black lines (and associated text) show a linear fit (orthogonal regression in log(y)-log(x)) to all observed positions in each map. Magenta lines and blue lines show a linear fit to a range of IFIR <6 × 10⁻³ erg s−1 cm−2 sr−1 and (0.4–7.7) erg s−1 cm−2 sr−1, respectively. We note that in each plot the number of line detections is different.
Current usage metrics show cumulative count of Article Views (full-text article views including HTML views, PDF and ePub downloads, according to the available data) and Abstracts Views on Vision4Press platform.
Data correspond to usage on the plateform after 2015. The current usage metrics is available 48-96 hours after online publication and is updated daily on week days.
Initial download of the metrics may take a while.