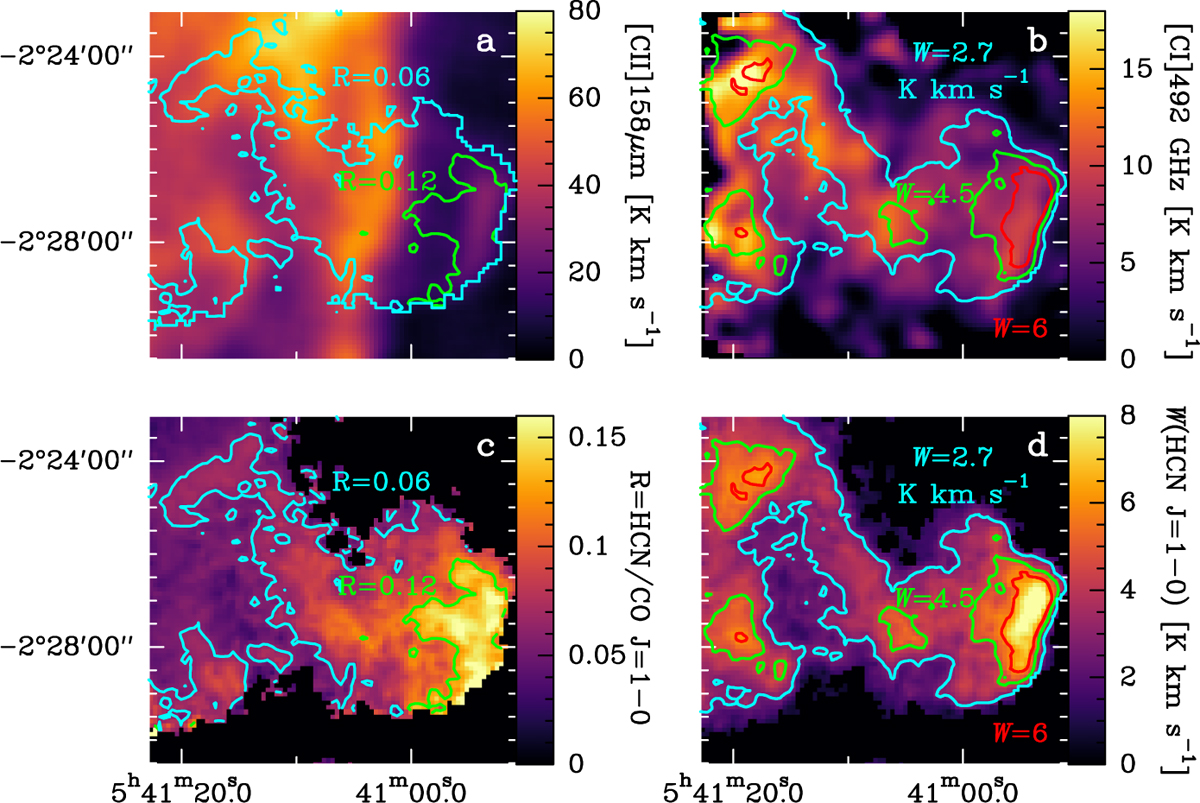
Fig. 17
Download original image
30″-resolution view of the Horse-head. (a) [C II] 158 µm (Pabst et al. 2017) and (b) [C I] 492 GHz (Philipp et al. 2006) integrated line intensity maps (from 7 to 18 km s−1). (c) R = HCN/CO intensity ratio and (d) HCN J = 1−0 line intensity maps. Contours on [C II] 158 µm map: HCN/CO ratio (R = 0.06 and 0.12). Contours on [C I] 492 GHz map: HCN J =1−0 surface brightness (W = 2.7, 4.5, and 6 K km s−1).
Current usage metrics show cumulative count of Article Views (full-text article views including HTML views, PDF and ePub downloads, according to the available data) and Abstracts Views on Vision4Press platform.
Data correspond to usage on the plateform after 2015. The current usage metrics is available 48-96 hours after online publication and is updated daily on week days.
Initial download of the metrics may take a while.