Fig. 16
Download original image
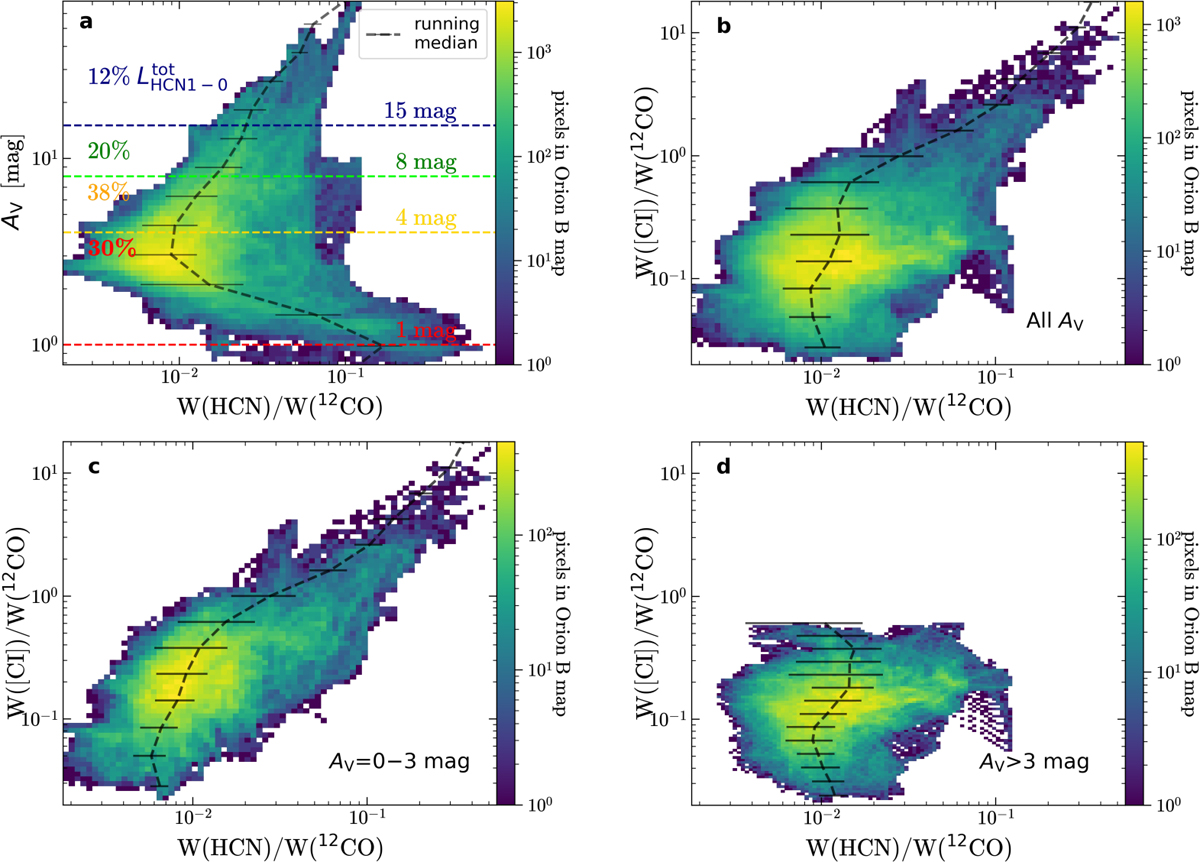
2D histograms. (a) Visual extinction AV as a function of the HCN/CO J =1–0 integrated intensity ratio (from maps at 120″ resolution). Dashed red, yellow, green, and blue horizontal lines are the visual extinction values 1, 4, 8, and 15 mag, respectively. Above each line, we show the percentage of the total HCN J = 1–0 luminosity that comes from the different AV ranges. (b), (c), and (d) 2D histogram of the observed [C I] 492 GHz/CO J =1–0 line intensity ratio (in units of K km s−1) as function of the observed HCN/CO J =1–0 line ratio for all AV, for AV < 3 mag, and for AV > 3 mag. The dashed black curve shows the running median. Error bars show the standard deviation in the x-axis.
Current usage metrics show cumulative count of Article Views (full-text article views including HTML views, PDF and ePub downloads, according to the available data) and Abstracts Views on Vision4Press platform.
Data correspond to usage on the plateform after 2015. The current usage metrics is available 48-96 hours after online publication and is updated daily on week days.
Initial download of the metrics may take a while.