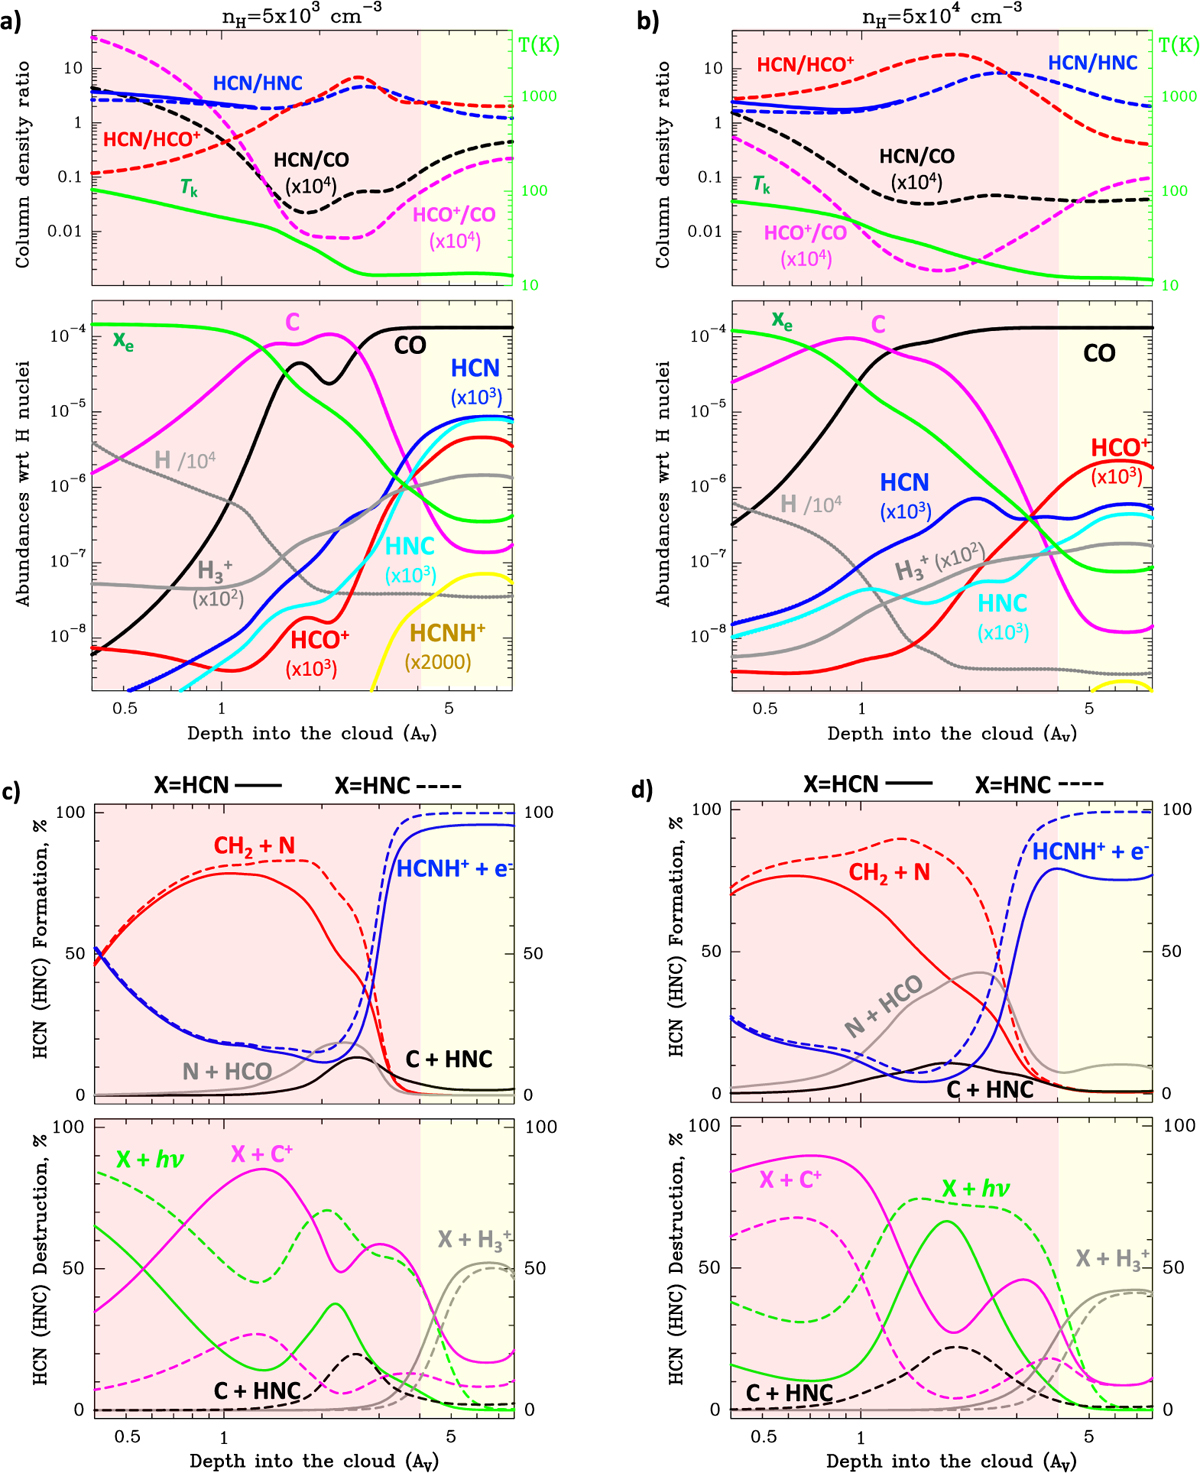
Fig. 13
Download original image
Constant density gas-phase PDR models with G0 = 100 and nH = 5 × 103 cm−3 (left) and 5 × 104 cm−3 (right). These models adopt Eb = 1200 K for Reaction (8). Upper panels in (a) and (b): dashed curves show the depth-dependent column density ratios of selected species (left y-axis). The blue continuous curves in the upper panels of (a) and (b) show the HCN/HNC column density ratio adopting Eb = 200 K. Green continuous curves show the temperature structure as a function of AV (right y-axis). Lower panels in (a) and (b): abundance profiles with respect to H nuclei. (c) and (d): Contribution (in percent) of the main formation and destruction reactions for HCN (continuous curves) and HNC (dashed curves).
Current usage metrics show cumulative count of Article Views (full-text article views including HTML views, PDF and ePub downloads, according to the available data) and Abstracts Views on Vision4Press platform.
Data correspond to usage on the plateform after 2015. The current usage metrics is available 48-96 hours after online publication and is updated daily on week days.
Initial download of the metrics may take a while.