Fig. 1
Download original image
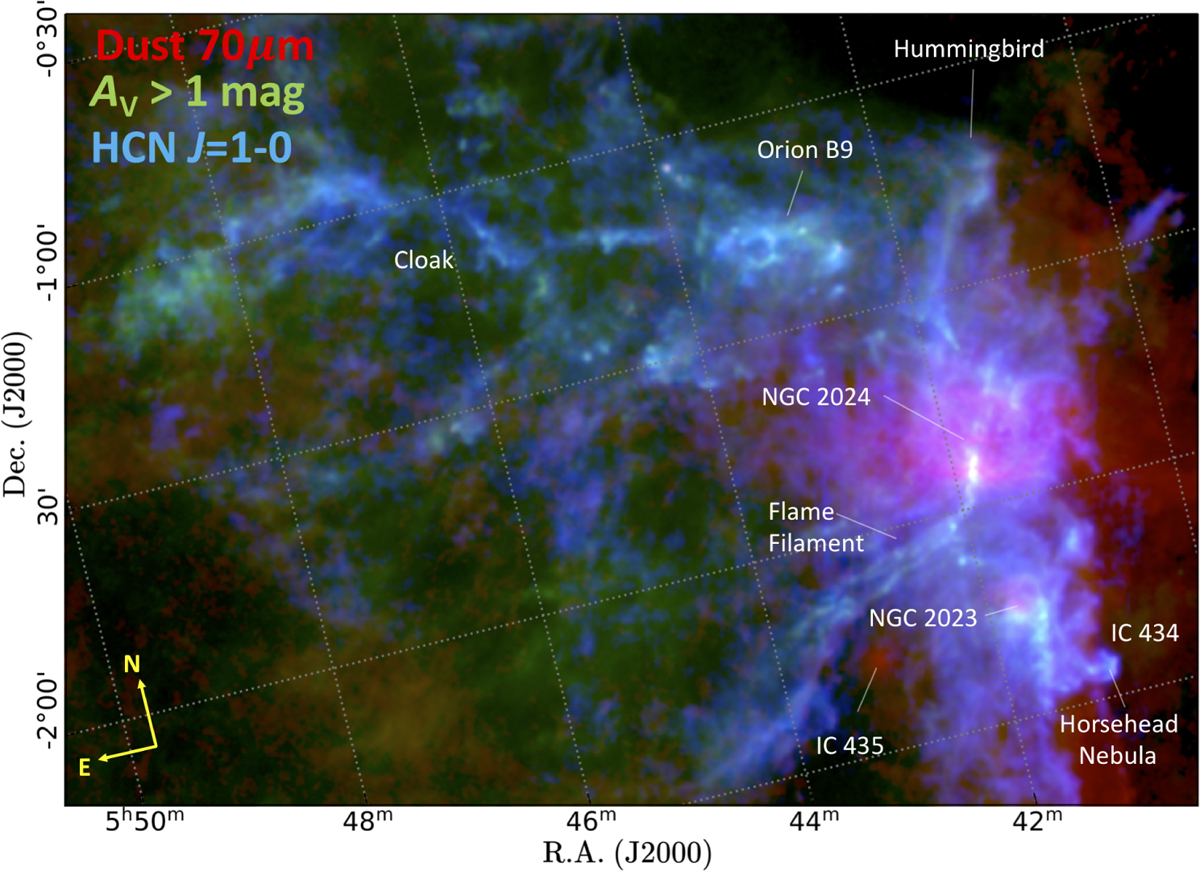
Composite image of the ~5 deg2 area mapped in Orion B. Red color represents the PACS 70 μm emission tracing FUV-illuminated extended warm dust. Green color represents the cloud depth in magnitudes of visual extinction, AV ∝ N(H2). Blue color represents the HCN J = 1−0 line intensity. We note that outside the main filaments most of the HCN J =1−0 emission is at AV < 4 mag.
Current usage metrics show cumulative count of Article Views (full-text article views including HTML views, PDF and ePub downloads, according to the available data) and Abstracts Views on Vision4Press platform.
Data correspond to usage on the plateform after 2015. The current usage metrics is available 48-96 hours after online publication and is updated daily on week days.
Initial download of the metrics may take a while.