Fig. A.1
Download original image
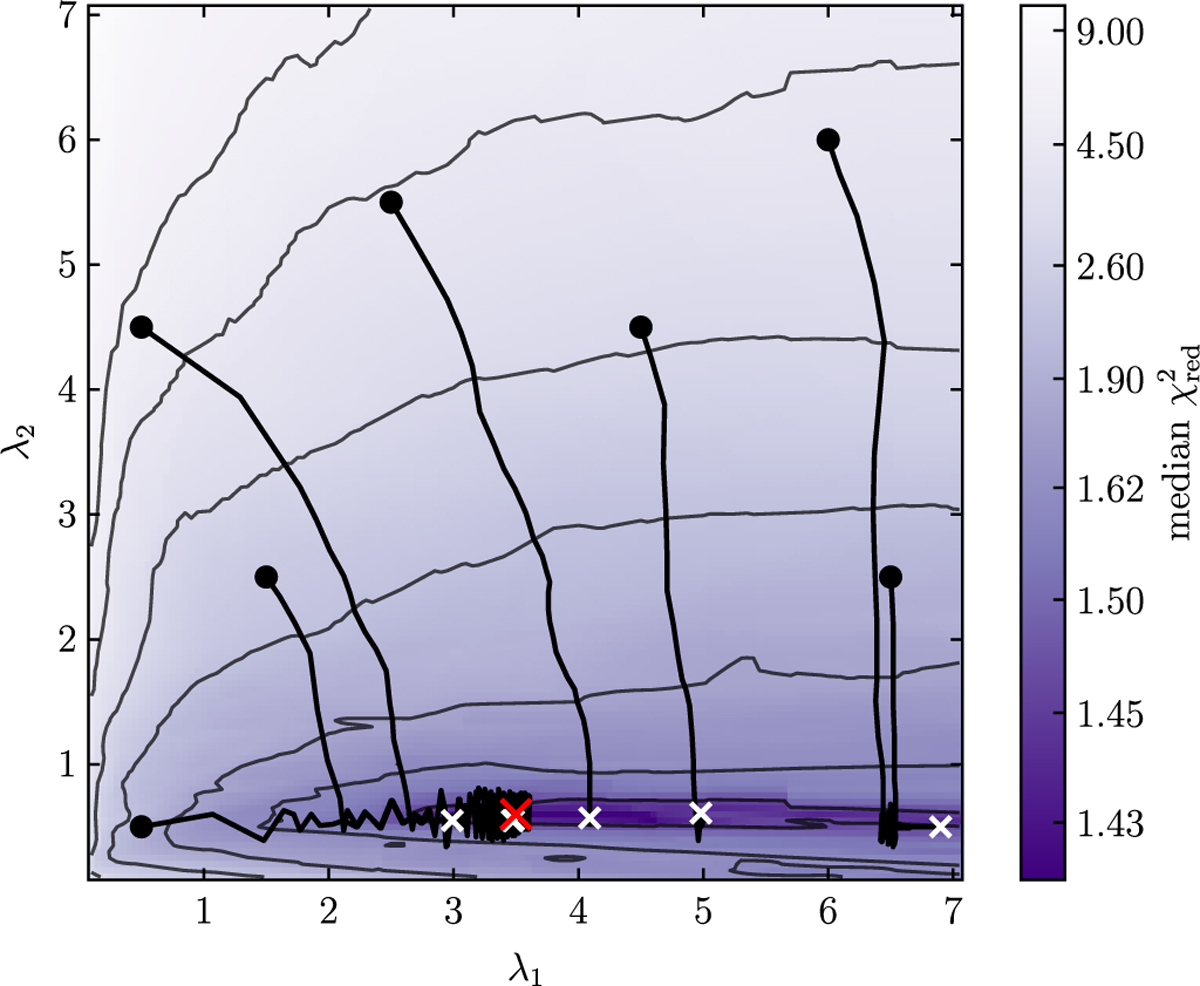
Smoothing parameter optimization using gradient descent. The map shows a sampled representation of the underlying λ parameter space in terms of the median value of the reduced chi square results. Initial values, tracks, and convergence locations of the (λ1, λ2) parameters during the optimization are represented by black circles, black lines, and white crosses, respectively. The red cross marks the global minimum in the sampled parameter space. Initial locations that start off too far from the global best solution (λ1 = 3.5, λ2 = 0.6) might converge to local minima with less accurate fit results.
Current usage metrics show cumulative count of Article Views (full-text article views including HTML views, PDF and ePub downloads, according to the available data) and Abstracts Views on Vision4Press platform.
Data correspond to usage on the plateform after 2015. The current usage metrics is available 48-96 hours after online publication and is updated daily on week days.
Initial download of the metrics may take a while.