Fig. 8
Download original image
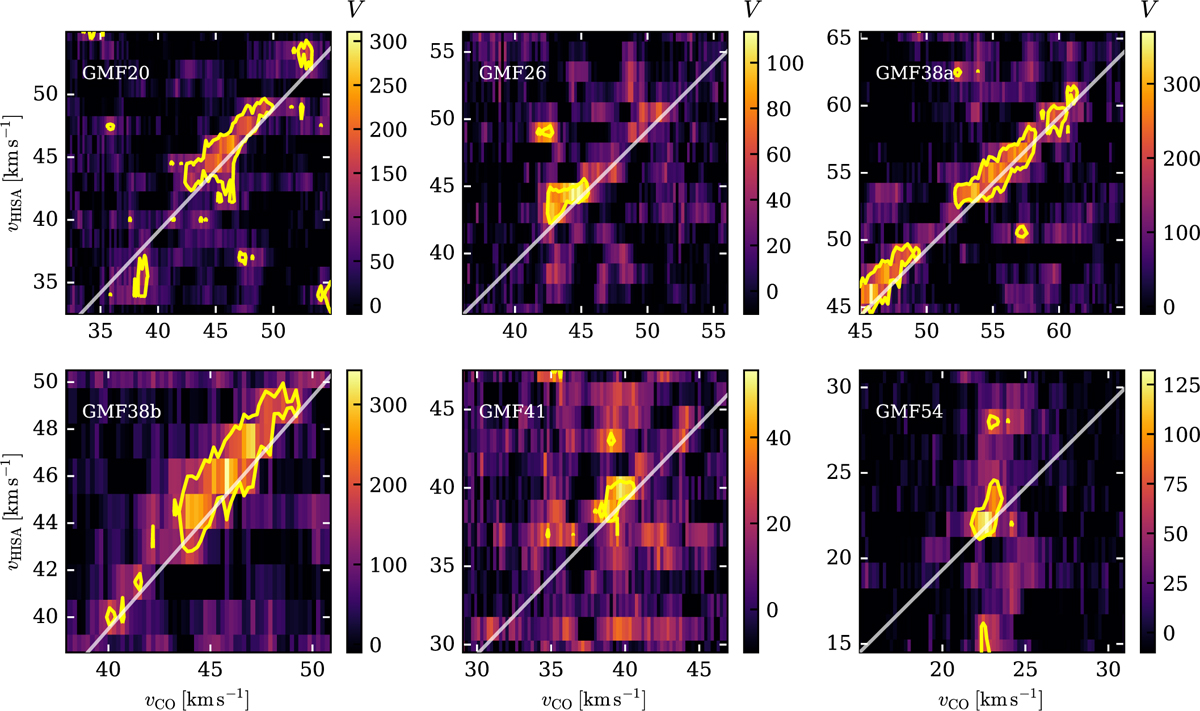
Correlation in the distribution of HISA and 13CO emission toward the six GMF regions as quantified by the projected Rayleigh statistic (V) in the HOG method (Soler et al. 2019). The panels present the computed spatial correlation between HISA and 13CO across velocities in terms of the projected Rayleigh statistic V for each filament region. The values of V are indicated by the color bar to the right of each panel. The white line in each panel shows the 1-to-1 correlation. The yellow contours show the 5σ threshold estimated from the Monte Carlo sampling. Large values of V indicate a high spatial correlation. Values of V close to zero indicate a random orientation of the HISA structures with respect to 13CO emission.
Current usage metrics show cumulative count of Article Views (full-text article views including HTML views, PDF and ePub downloads, according to the available data) and Abstracts Views on Vision4Press platform.
Data correspond to usage on the plateform after 2015. The current usage metrics is available 48-96 hours after online publication and is updated daily on week days.
Initial download of the metrics may take a while.