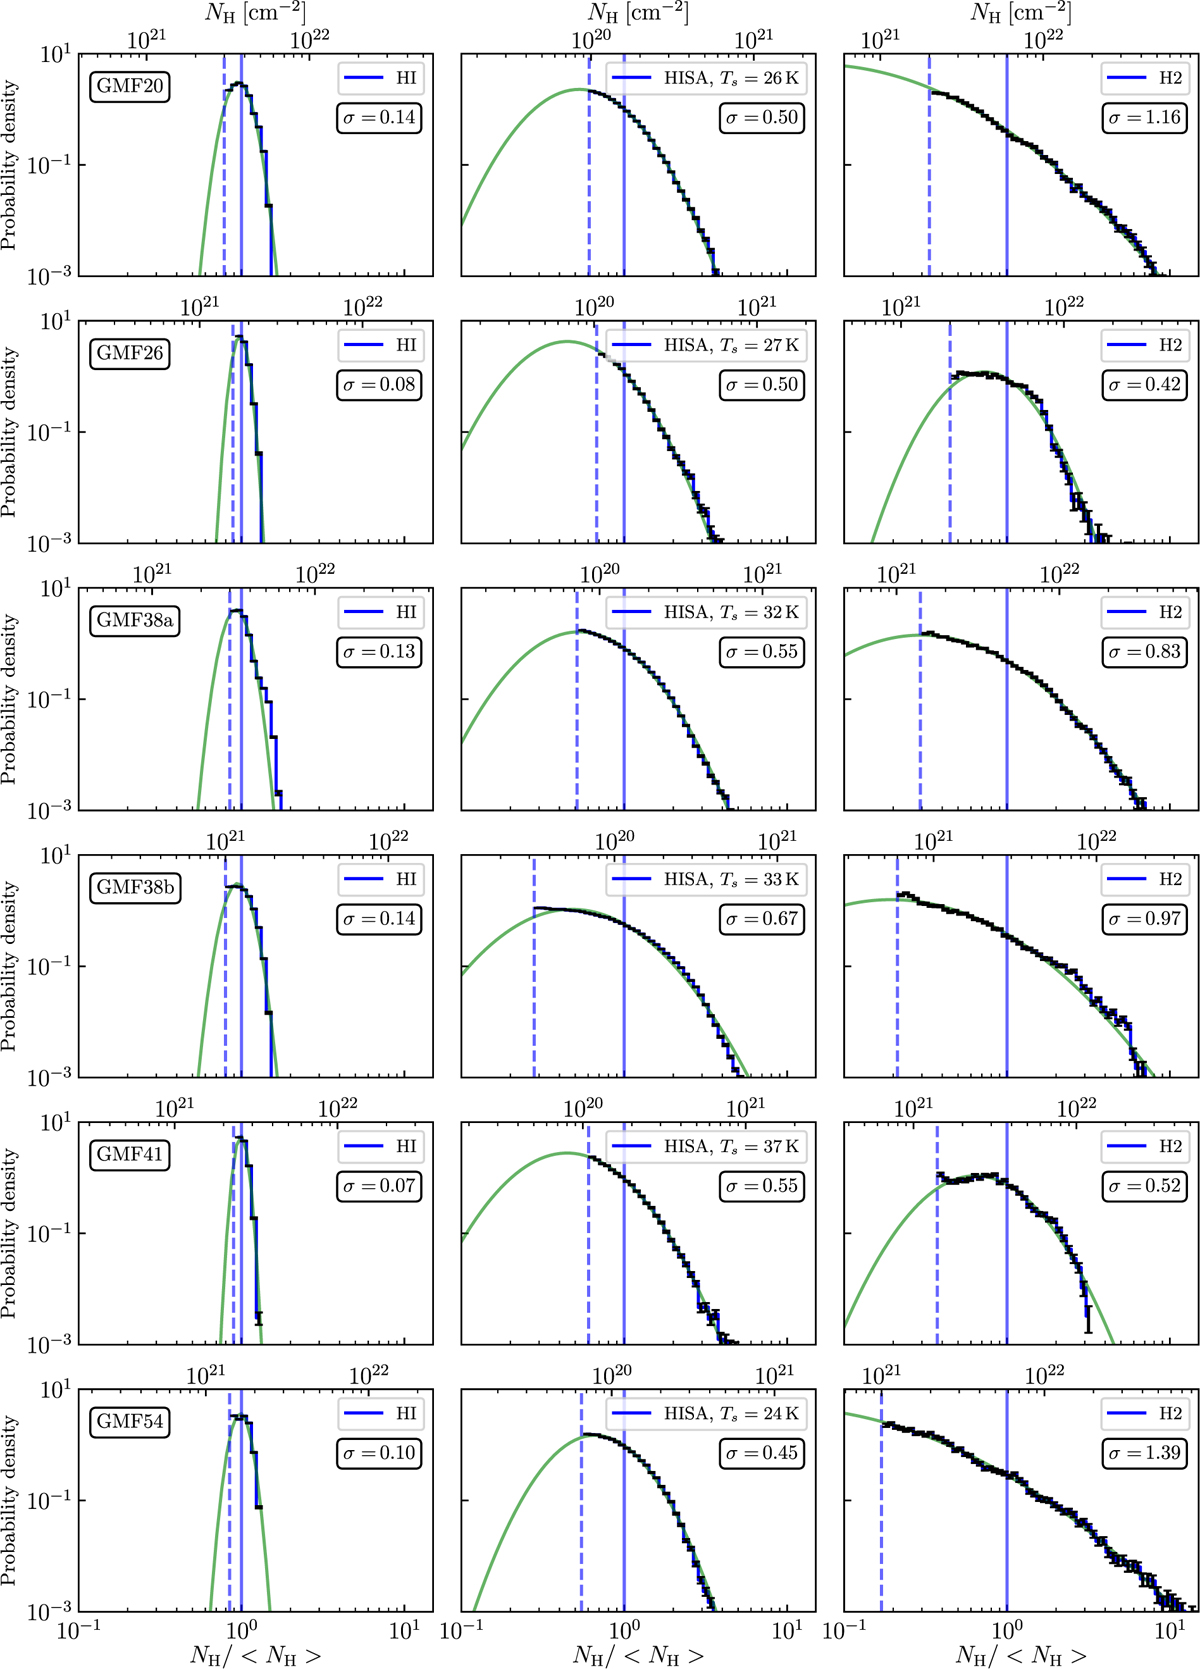
Fig. 6
Download original image
Normalized column density PDFs of H I, HISA, and H2 toward the giant filament regions. Each row shows the H I, HISA, and H2 N-PDF toward one GMF region. Left panels: N-PDFs traced by H I emission. The distributions are derived from the H I column densities that have been corrected for optical depth and continuum emission. Middle panels: the N-PDFs of the gas traced by HISA. Right panels: H2 N-PDFs traced by 13CO in units of hydrogen atoms per cm−2. The green curves indicate a log-normal fit to the distributions. The blue vertical dashed and solid lines mark the column density threshold and mean column density, respectively.
Current usage metrics show cumulative count of Article Views (full-text article views including HTML views, PDF and ePub downloads, according to the available data) and Abstracts Views on Vision4Press platform.
Data correspond to usage on the plateform after 2015. The current usage metrics is available 48-96 hours after online publication and is updated daily on week days.
Initial download of the metrics may take a while.