Open Access
Fig. 5
Download original image
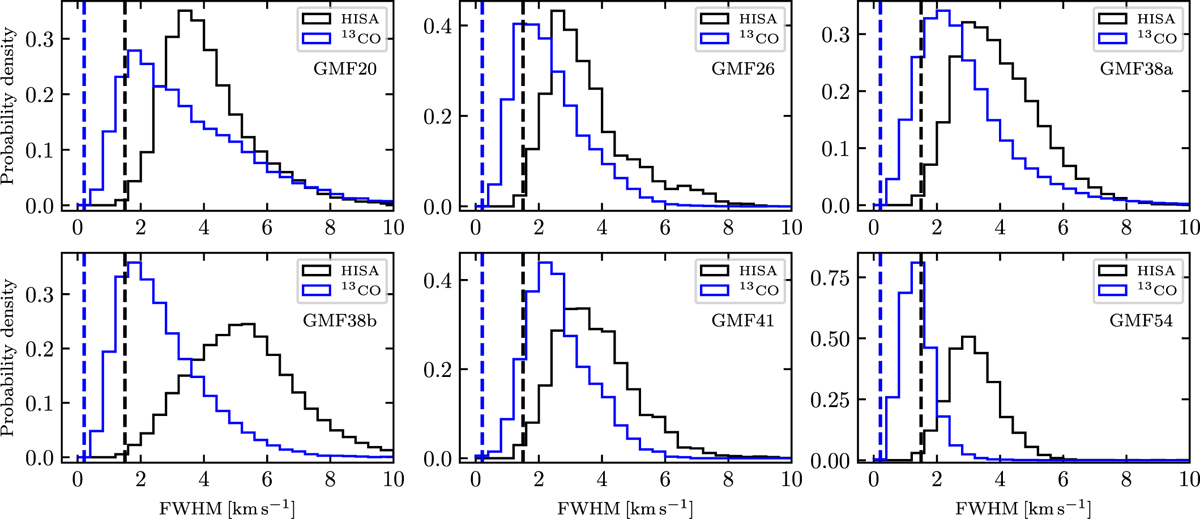
Histograms of fit line widths. The panels show for each of the six giant filament regions the normalized histogram of FWHM line widths of HISA and 13CO in black and blue, respectively. The black and blue vertical dashed lines mark the spectral resolution limit of the HISA and 13CO data, respectively.
Current usage metrics show cumulative count of Article Views (full-text article views including HTML views, PDF and ePub downloads, according to the available data) and Abstracts Views on Vision4Press platform.
Data correspond to usage on the plateform after 2015. The current usage metrics is available 48-96 hours after online publication and is updated daily on week days.
Initial download of the metrics may take a while.