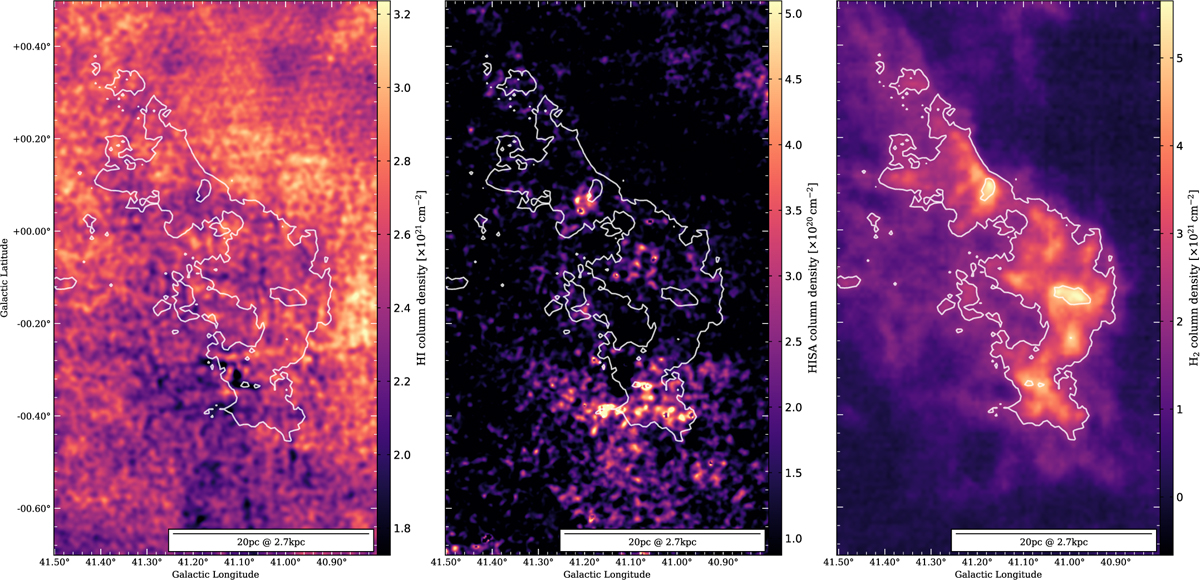
Fig. F.5
Download original image
Column density toward GMF41. These maps show the column densities of atomic hydrogen traced by H I emission, the cold hydrogen gas traced by HISA, and molecular hydrogen traced by 13CO emission, respectively. The column densities are integrated over the velocity range of the filament region given in Table 1. The white contours in both panels show the integrated MWISP 13CO emission at the levels 6.0, 12.0, 24.0, and 34.0 K km s−1. Left panel: H I column density traced by H I emission. Middle panel: HISA column density. Right panel: H2 column density traced by 13CO.
Current usage metrics show cumulative count of Article Views (full-text article views including HTML views, PDF and ePub downloads, according to the available data) and Abstracts Views on Vision4Press platform.
Data correspond to usage on the plateform after 2015. The current usage metrics is available 48-96 hours after online publication and is updated daily on week days.
Initial download of the metrics may take a while.